

Ukrainian Immigrants in the United States

Girls in traditional Ukrainian attire. (Photo: Oleksandra Kharkova/iStock.com)
Russia’s full-scale invasion of Ukraine in February 2022 created massive internal and cross-border displacement. An estimated 6.9 million Ukrainians had left their country as of December 2025, with an additional 3.7 million Ukrainians displaced internally.
While most Ukrainians have gone to destinations elsewhere in Europe, a sizable number have come to the United States. More than 510,000 Ukrainian immigrants lived in the United States in 2024, an increase of 28 percent from 2021. In the United States, they have joined a population of Ukrainian immigrants and descendants that dates back to the late 1800s, when Ukrainian migrants first came to work, primarily in coal mines and agriculture. Between 1899 and 1914, an estimated 254,000 Ukrainian immigrants arrived in the United States. The next wave of Ukrainian immigration comprised mostly highly educated and urban Ukrainians amid their country’s absorption into the Soviet Union in the late 1910s and early 1920s. After World War II, between 1947 and 1955, about 80,000 Ukrainians arrived, including many former residents of displaced person camps in Austria and Germany. Then between 1992 and 1997, the United States admitted an estimated 108,000 Ukrainians in the aftermath of the Soviet Union’s collapse, including many Evangelical Christians and Jews immigrating under the Lautenberg Program which offered protection to nationals of former Soviet nationals facing religious persecution.
Since April 2022, the United States has offered Temporary Protected Status (TPS) to certain Ukrainians already present in the United States; as of March 2025, more than 101,000 Ukrainians held TPS, which as of this writing remained active through October 2026. (While the Trump administration has terminated TPS designations for some other countries and contemplated doing so for Ukraine, it had not acted as of this writing.) Beyond TPS for Ukrainians already in the country, the prior Biden administration created a new pathway for Ukrainians to enter: the Uniting for Ukraine humanitarian parole program. Although new applications for this program were paused by the Trump administration in January 2025, 240,000 Ukrainians had received parole through it, giving them relief from deportation and access to a work permit. For a brief period in 2022, the U.S. government also temporarily admitted Ukrainians who arrived at the U.S.-Mexico border without authorization to enter.
The future for recent arrivals is uncertain, given the Trump administration’s stance on the TPS program, as well as administrative delays for parolees to renew their protections. Additionally, the government has paused issuance of all Diversity Visas, which may disproportionately impact Ukrainians seeking permanent legal status, since nearly one in four new green-card holders from Ukraine in fiscal year (FY) 2023 (the most recent year for which data are available) arrived through this pathway. Many Ukrainians also received a green card after arriving through the refugee or asylum systems, both of which the Trump administration has severely curtailed.
Compared to other U.S. immigrant groups. Ukrainians are more likely to be U.S. citizens and have higher levels of educational attainment, although they report lower median household income.
This Spotlight provides information on the Ukrainian immigrant population in the United States, focusing on its size, geographic distribution, and socioeconomic characteristics.
Click on the bullet points below for more information:
- Size of Immigrant Population over Time
- Distribution by State and Key Cities
- English Proficiency
- Age, Education, and Employment
- Income and Poverty
- Immigration Pathways and Naturalization
- Unauthorized Immigrant Population
- Health Coverage
- Diaspora
- Top Global Destinations
- Remittances
Size of Immigrant Population over Time
In 2000, the first time the U.S. Census Bureau disaggregated people born in various republics of the former Soviet Union, there were about 275,000 Ukrainian immigrants in the United States. This population grew by 19 percent by 2010 and by another 22 percent from 2010 to 2021, before Russia’s full-scale invasion (see Figure 1). From 2021 to 2024, the number of Ukrainian immigrants increased by 28 percent, about 2.5 times faster than the overall U.S. foreign-born population (11 percent).
Figure 1. Ukrainian Immigrant Population in the United States, 2000-24
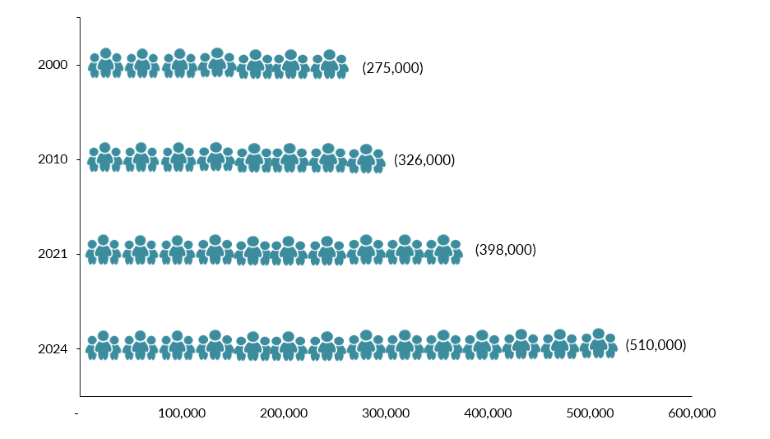
Note: The 2000 Census was the first year that Ukrainian immigrants could be disaggregated because Ukraine was part of the Union of the Soviet Socialist Republics (USSR) until its dissolution in 1991.
Sources: Data from U.S. Census Bureau’s 2010 and 2024 American Community Surveys (ACS), and Campbell J. Gibson and Kay Jung, "Historical Census Statistics on the Foreign-Born Population of the United States: 1850-2000" (Working Paper no. 81, U.S. Census Bureau, Washington, DC, February 2006), available online.
Distribution by State and Key Cities
Fifty-two percent of Ukrainian immigrants resided in one of four states as of the 2020-24 period: New York (19 percent), California (15 percent), and Washington and Illinois (9 percent apiece). Their top counties of residence were Kings County, New York; Cook County, Illinois; and Sacramento and Los Angeles counties, California. Together, these four counties were home to one-quarter of all Ukrainian immigrants in the United States.
Click here for an interactive map that highlights the states and counties with the highest concentrations of immigrants from Ukraine or other countries.
The top cities for Ukrainian immigrants were the greater New York, Chicago, Seattle, Sacramento, and Los Angeles metropolitan areas. Nearly half (46 percent) of Ukrainian immigrants lived in one of these five cities as of 2020-24.
Click here for an interactive map that highlights the metro areas with the most immigrants from Ukraine or other regions.
Ukrainian immigrants’ proficiency in English tends to be slightly lower than that of the overall U.S. foreign-born population. In 2024, 52 percent of Ukrainian immigrants ages 5 and over reported speaking English less than “very well,” compared to 47 percent of all immigrants.
Meanwhile, 11 percent of Ukrainians reported speaking only English at home, compared to 16 percent of the total foreign-born population.
Age, Education, and Employment
In 2024, 72 percent of Ukrainian immigrants were of working age (18 to 64 years old), lower than the share of all immigrants (76 percent) but higher than that of U.S. natives (58 percent; see Figure 2). Ukrainian immigrants’ median age was 42, younger than that of immigrants overall (47) but higher than the U.S. born (37).
Figure 2. Age Distribution of the U.S. Population, by Origin, 2024
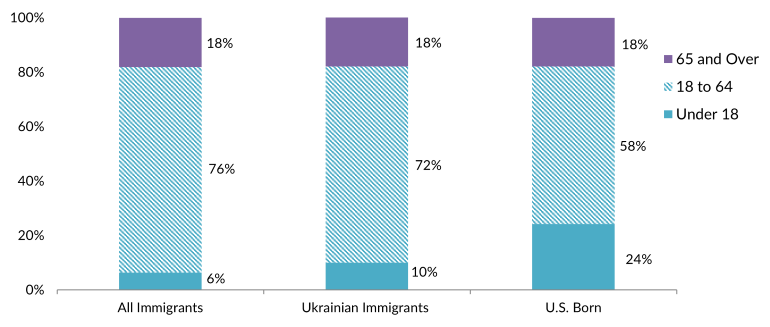
Note: Percentages may not add up to 100 as they are rounded to the nearest whole number.
Source: MPI tabulation of data from the U.S. Census Bureau’s 2024 ACS.
Compared to all foreign- and U.S.-born adults, Ukrainians tend to have higher educational attainment. In 2024, 54 percent of Ukrainian immigrants held a bachelor's degree or higher, compared to 36 percent of all immigrants and 37 percent of the U.S. born (see Figure 3).
Figure 3. Educational Attainment of the U.S. Population (ages 25 and older), by Origin, 2024
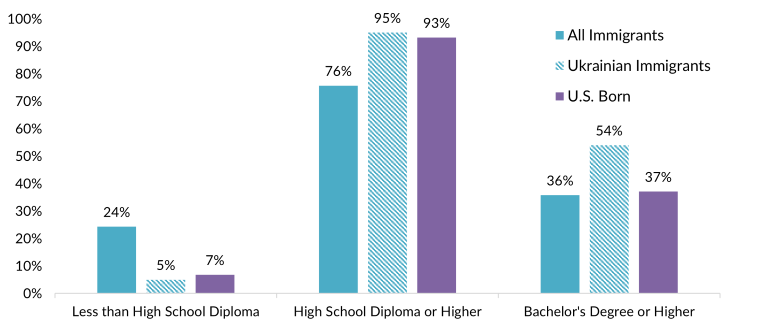
Note: Percentages may not add up to 100 as they are rounded to the nearest whole number.
Source: MPI tabulation of data from the U.S. Census Bureau 2024 ACS.
Click here for data on immigrants’ educational attainment by country of origin and overall.
Slightly more than 2,300 students from Ukraine were enrolled in U.S. higher education institutions during the 2024-25 academic year, according to the Institute of International Education, making up a very small portion of all 1.2 million international students in the country.
Ukrainian immigrants had a civilian labor-force participation rate of 67 percent in 2024, on par with the overall foreign-born population (68 percent) and slightly higher than that of the U.S. born (63 percent). About 46 percent of Ukrainian immigrants were employed in management, business, science, and arts occupations, comprising the largest such group, followed by those in service occupations (16 percent; see Figure 4).
Figure 4. Employed Workers in the Civilian Labor Force (ages 16 and older), by Occupation and Origin, 2024
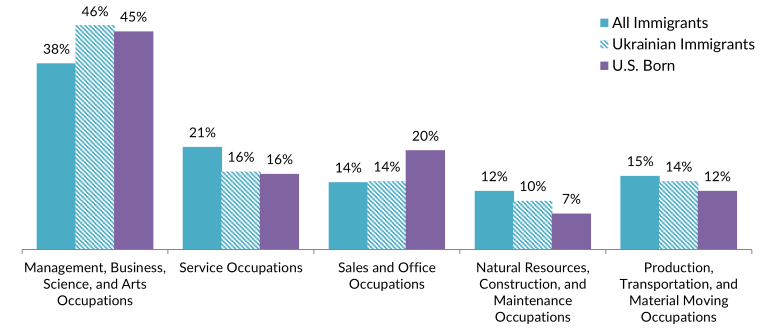
Note: Percentages may not add up to 100 as they are rounded to the nearest whole number.
Source: MPI tabulation of data from the U.S. Census Bureau’s 2024 ACS.
Ukrainian immigrants’ average median household income in 2024 was $80,500, slightly lower than that of both all immigrant (about $82,400) and U.S.-born households ($81,400).
In 2024, 14 percent of Ukrainian immigrants lived below the poverty line, the same rate as the total foreign-born population, and slightly more than the 12 percent of U.S.-born residents. (The U.S. Census Bureau defines poverty as having an income below $32,100 for a family of four in 2024.)
Immigration Pathways and Naturalization
As of 2024, about 58 percent of Ukrainian immigrants were naturalized U.S. citizens, compared to 51 percent of immigrants overall. Thirty-four percent of Ukrainian immigrants entered the United States before 2000, whereas 47 percent arrived since 2010 (see Figure 5).
Figure 5. Ukrainian and All Immigrants in the United States, by Period of Arrival, 2024
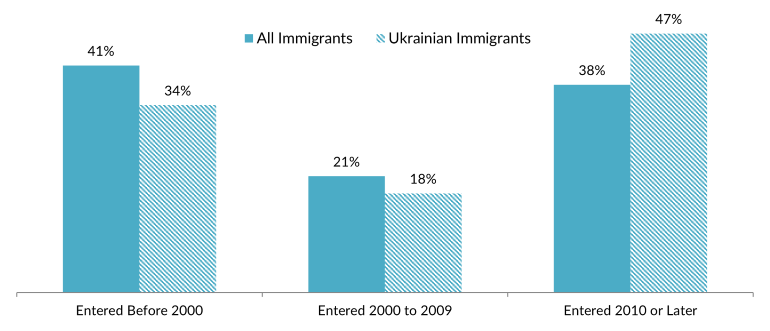
Note: Percentages may not add up to 100 as they are rounded to the nearest whole number.
Source: MPI tabulation of data from the U.S. Census Bureau’s 2024 ACS.
Just under 11,300 Ukrainian immigrants became lawful permanent residents (LPRs, also known as green-card holders) in FY 2023. The main pathway to permanent residence for Ukrainians was via family reunification, which was used by 48 percent of all new green-card holders that year. About 17 percent of the Ukrainians who became LPRs in FY 2023 did so after being resettled as refugees or being granted asylum, compared to 8 percent of all new LPRs. Notably, 24 percent of Ukrainian LPRs arrived through the Diversity Visa lottery program, compared to only 6 percent of all new LPRs.
Unauthorized Immigrant Population
The Migration Policy Institute (MPI) estimates that about 47,000 unauthorized immigrants were from Ukraine as of mid-2023, accounting for less than 0.5 percent of all 13.7 million unauthorized immigrants in the United States.
Click here for MPI data of the unauthorized immigrant population in the United States as of mid-2023.
Many unauthorized immigrants have benefitted from liminal (temporary) statuses offering protection from deportation and work authorization. In recent years, many Ukrainians have benefitted from “twilight” legal statuses including TPS and humanitarian parole.
Additionally, an estimated 90 Ukrainian immigrants as of June 2025 were beneficiaries of the Deferred Action for Childhood Arrivals (DACA) program, which provides temporary deportation relief and work authorization to unauthorized immigrants who arrived as children and met the program’s education and other eligibility criteria. This population represents a tiny share of all 515,600 active DACA recipients.
Click here to view the top origin countries of DACA recipients and their U.S. states of residence.
Ukrainian immigrants were less likely than immigrants overall to lack health insurance as of 2024 (10 percent versus 18 percent, respectively; see Figure 6).
Figure 6. Health Coverage for Ukrainian Immigrants, All Immigrants, and the U.S. Born, 2024
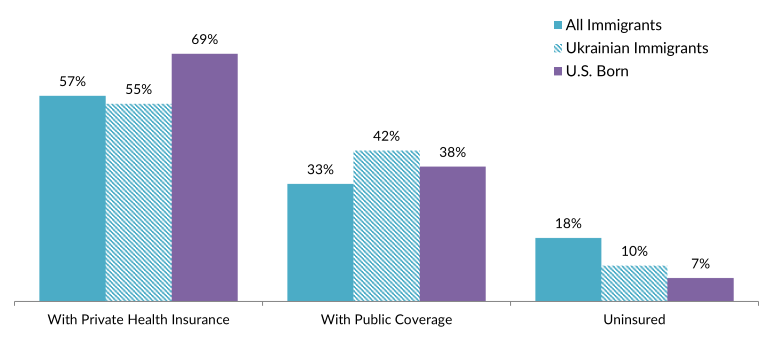
Note: The sum of shares by type of insurance is likely to be greater than 100 because people may have more than one type of insurance.
Source: MPI tabulation of data from the U.S. Census Bureau’s 2024 ACS.
The Ukrainian diaspora in the United States was comprised of an estimated 1.4 million individuals who were either born in Ukraine or reported Ukrainian ancestry, according to MPI tabulation of data from the U.S. Census Bureau’s 2024 American Community Survey.
Click here to see estimates of the 35 largest diasporas groups in the United States.
Globally, approximately 9.8 million migrants from Ukraine resided outside their country of birth, according to mid-2024 estimates by the United Nations Population Division. The top receiving countries were Russia (2.9 million), Germany (1.4 million), Poland (1.1 million), and the Czech Republic (515,000), followed by the United States. Like Ukraine, Russia was once part of the Soviet Union; the high number of Ukrainian-born people there reflects a mix of internal migration during the Soviet era, international migration after the fall of the Soviet Union, and migration since Russia’s 2022 invasion of Ukraine.
About 5.3 million Ukrainians displaced by Russia’s invasion have gone to countries across Europe, according to the UN High Commissioner for Refugees (UNHCR). At the end of 2025, 4.4 million Ukrainians held temporary protected status in the European Union.
Click here to view an interactive map showing where migrants from Ukraine and other origins have settled worldwide.
Migrants and other individuals worldwide sent approximately $12.6 billion in remittances via formal channels to Ukraine in 2024, a 16-percent decrease from nearly $15 billion in 2023.
Figure 7. Annual Remittance Flows to Ukraine, 2000-24
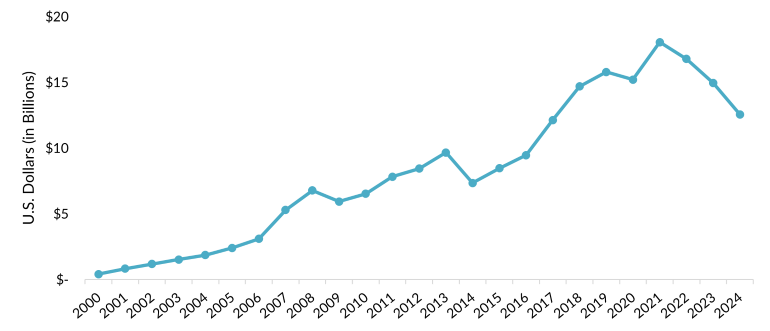
Note: Data for 2024 are an estimate.
Source: Dilip Ratha, Sonia Plaza, and Eung Ju Kim, “In 2024, Remittance Flows to Low- and Middle-Income Countries Are Expected to Reach $685 Billion, Larger than FDI and ODA Combined,” World Bank blog post, December 18, 2024, available online.
Click here to view an interactive chart showing annual remittances received and sent by Ukraine and others.
Sources
American Immigration Lawyers Association (AILA). 2026. Practice Alert: TPS and Parole Status Updates Chart. Updated January 28, 2026. Available online.
Eurostat. 2026. Temporary Protection for 4.35 Million in December 2025. February 10, 2026. Available online.
Gibson, Campbell J. and Kay Jung. 2006. Historical Census Statistics on the Foreign-Born Population of the United States: 1850-2000. Working Paper no. 81, U.S. Census Bureau, Washington, DC, February 2006. Available online.
Institute of International Education (IIE). N.d. International Students: All Places of Origin. Accessed January 15, 2026. Available online.
International Organization for Migration (IOM). 2024. World Migration Report 2024. Geneva: IOM. Available online.
---. 2026. DTM Ukraine — Internal Displacement Report — General Population Survey Round 22 (January 2026). Kyiv: IOM.
Miziuk, George A. 2024. Ukrainians in the U.S. Embassy of Ukraine in the United States of America, August 6, 2024. Available online.
National Archives Foundation. N.d. Refugee Act of 1980. Accessed October 23, 2025. Available online.
National Immigration Forum. 2026. Temporary Protected Status (TPS): Fact Sheet. January 13, 2026. Available online.
Ratha, Dilip, Sonia Plaza, and Eung Ju Kim. 2024. In 2024, Remittance Flows to Low- and Middle-Income Countries Are Expected to Reach $685 Billion, Larger than FDI and ODA Combined. World Bank blog post, December 18, 2024. Available online.
Rivera, Salvador. 2022. Ukrainians Told No More Crossings on Foot into U.S. through Ports of Entry. Border Report, April 22, 2022. Available online.
Satzewich, Vic. 2002. The Ukrainian Diaspora. London: Routledge.
UN High Commissioner for Refugees (UNHCR). 2026. Ukraine Refugee Situation. Updated January 16, 2026. Available online.
---. N.d. Ukraine Emergency. Accessed January 22, 2026. Available online.
UN Population Division. 2024. International Migrant Stock 2024 by Destination and Origin. Available online.
U.S. Census Bureau. N.d. 2024 American Community Survey—Advanced Search: S0201 Selected Population Profile in the United States. Accessed January 25, 2026. Available online.
U.S. Citizenship and Immigration Services (USCIS). 2025. Count of Active DACA Recipients by Month of Current DACA Expiration as of June 30, 2025. Available online.
U.S. Department of Homeland Security (DHS), Office of Homeland Security Statistics (OHSS). 2024. 2023 Yearbook of Immigration Statistics. Washington, DC: DHS OHSS. Available online.
U.S. Department of Homeland Security (DHS), Office of Strategy, Policy, and Plans. 2024. Uniting for Ukraine: Process Overview and Assessment. Washington, DC: DHS. Available online.
U.S. State Department. 2025. Diversity Visa Issuance Updated Guidance. Updated December 23, 2025. Available online.
Wilson, Jill H. 2025. Temporary Protected Status and Deferred Enforced Departure. Washington, DC: Congressional Research Service (CRS). Available online.