

Central American Immigrants in the United States
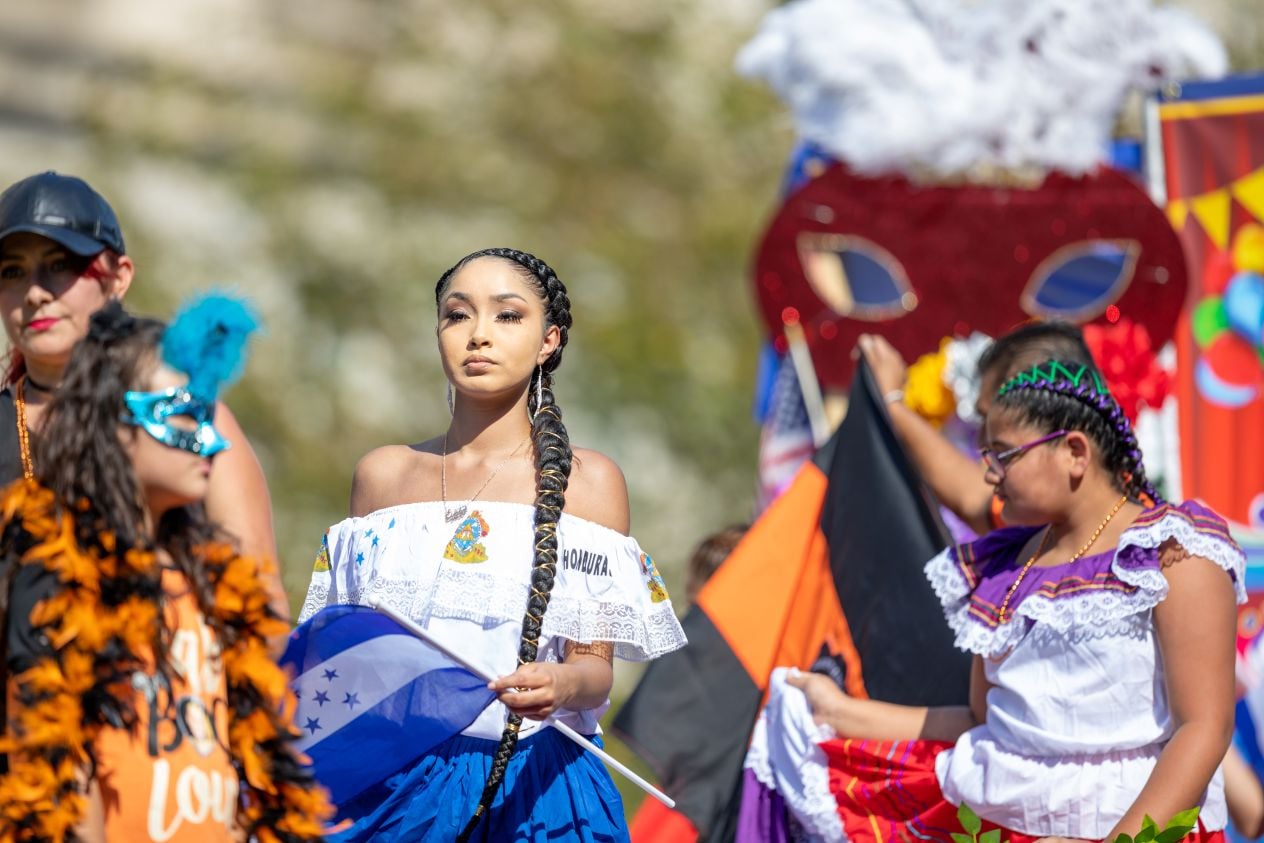
A woman from Honduras in a parade in Washington, DC. (Photo: Roberto Galan/iStock.com)
Haga clic aquí para leer este artículo en español.
For more than 40 years, political and economic instability, widespread violence, and environmental disasters in Central America have combined to prompt migration to the United States, chiefly from El Salvador, Guatemala, and Honduras. Climate-related events have also contributed to emigration, with prolonged droughts, hurricanes, and other extreme-weather occurrences disrupting agricultural production and displacing rural populations throughout the region.
As family and unaccompanied minor encounters at the U.S.-Mexico border have increased over the past decade, U.S. administrations of both political parties have responded with efforts to address the root causes of this migration, deter arrivals through increased enforcement, or offer alternative legal pathways for certain people in need. U.S. Customs and Border Protection (CBP) encountered nationals of El Salvador, Guatemala, Honduras, and Nicaragua at the U.S.-Mexico border 433,000 times in fiscal year (FY) 2024, a decline from the historic high of about 705,500 in FY 2022. Recent months have seen even sharper reductions in arrivals from the region seeking to join the more than 4.3 million Central American immigrants resident in the United States as of 2023.
The foreign born from Central America accounted for 9 percent of all 47.8 million U.S. immigrants in 2023, representing a fast-growing population. A significant share of these immigrants lack legal status, although nearly one-third are naturalized citizens, and many others are lawful permanent residents (LPRs, also known as green-card holders). While employment rates differ among nationalities, Central Americans are more likely than the overall foreign-born population to be in the U.S. labor force and to have arrived since 2010, but less likely to have a high school diploma.
This Spotlight provides information on the Central American immigrant population in the United States, focusing on its size, geographic distribution, and socioeconomic characteristics.
Click on the bullet points below for more information:
- Size of Immigrant Population over Time and by Country
- Distribution by State and Key Cities
- English Proficiency
- Age, Education, and Employment
- Income and Poverty
- Immigration Pathways and Naturalization
- Unauthorized Immigrant Population
- Health Coverage
- Diaspora
- Top Global Destinations
- Remittances
Size of Immigrant Population over Time and by Country
In 1980, there were about 354,000 Central American immigrants in the United States. By 1990, that population had more than tripled, and there has been strong growth in every subsequent decade (see Figure 1). From 2010 to 2023, the number of Central American immigrants grew by 42 percent, more than twice as fast as the overall U.S. immigrant population (20 percent).
Figure 1. Central American Immigrant Population in the United States, 1980-2023
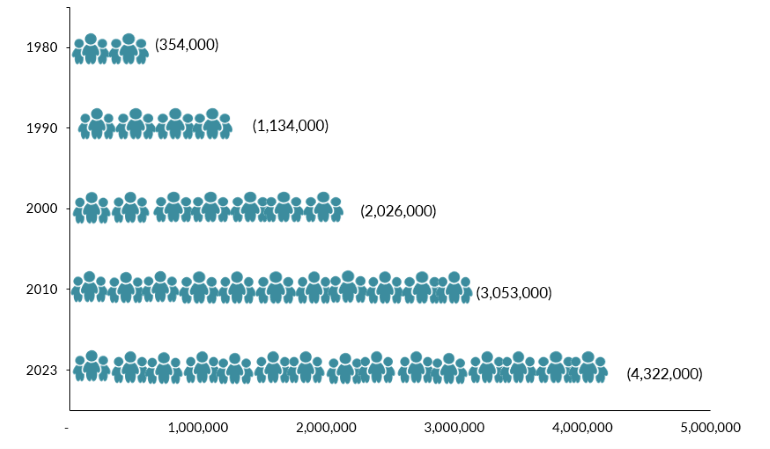
Source: Data from U.S. Census Bureau’s 2010 and 2023 American Community Surveys (ACS), and Campbell J. Gibson and Kay Jung, "Historical Census Statistics on the Foreign-Born Population of the United States: 1850-2000" (Working Paper no. 81, U.S. Census Bureau, Washington, DC, February 2006), available online.
Immigration from El Salvador, Guatemala, and Honduras has been the largest contributor to the growth of the Central America-born population in the United States since 1980. Roughly 85 percent of Central Americans in the United States in 2023 were born in one of these three countries (see Table 1). The fastest-growing groups since 2010 are Hondurans (whose numbers grew by 79 percent between 2010 and 2023), Nicaraguans (52 percent), and Guatemalans (50 percent). The number of Salvadorans, the largest origin group, grew by 23 percent during the same period.
Table 1. Central American Immigrants in the United States, by Country of Origin, 2023
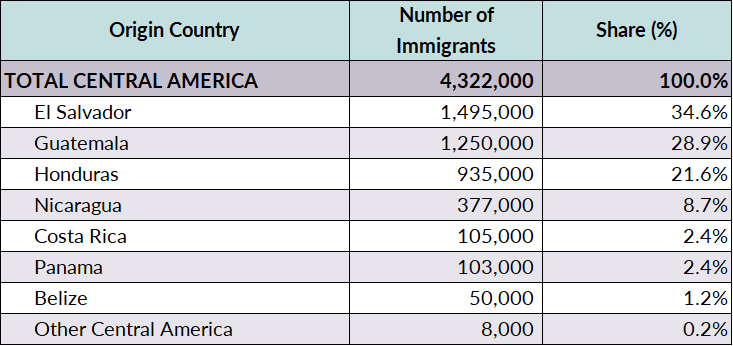
Source: Migration Policy Institute (MPI) tabulation of data from the U.S. Census Bureau’s 2023 ACS.
Distribution by State and Key Cities
Most Central American immigrants live in states along the U.S.-Mexico border or near the coasts. More than half were in California, Texas, Florida, New York, or Maryland as of the 2019-23 period. The top five counties for Central Americans were Los Angeles County, California; Harris County, Texas; Miami-Dade County, Florida; Dallas County, Texas; and Prince George’s County, Maryland. Together, these five counties were home to 28 percent of all Central American immigrants in the United States.
Click here for an interactive map that highlights the states and counties with the highest concentrations of immigrants from Central America or other regions.
As of the 2019-23 period, three cities were home to one-third of all immigrants from Central America: the greater Los Angeles (where about 14 percent lived), New York City (10 percent), and Washington, DC (8 percent) metropolitan areas. Central American immigrants accounted for 5 percent of the total population of the greater Washington, DC area, more than any other comparable city.
Figure 2. Top Metropolitan Destinations for Central American Immigrants in the United States, 2019-23
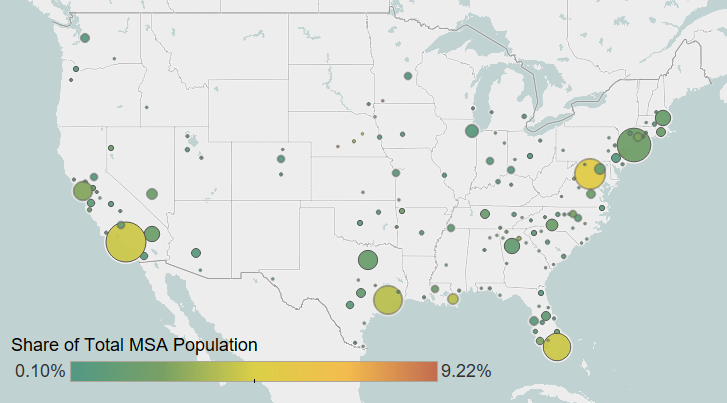
Note: Pooled 2019-23 ACS data were used to get statistically valid estimates at the metropolitan statistical-area level for smaller-population geographies. Not shown are the populations, which are small in size, in Alaska or Hawaii. For details, visit MPI’s Migration Data Hub for an interactive map showing geographic distribution of immigrants by metro area, available online.
Source: MPI tabulation of data from U.S. Census Bureau’s pooled 2019-23 ACS.
Click here for an interactive map that highlights the metro areas with the most immigrants from Central America or other regions.
Nearly all Central American immigrants speak a language other than English as their primary language, and they tend to be less proficient in English than the overall U.S. foreign-born population. In 2023, about 67 percent of Central American immigrants ages 5 and over reported speaking English less than “very well,” compared to 47 percent of all immigrants. Guatemalans and Hondurans (72 percent apiece) were more likely than other Central Americans to speak English less than “very well.”
Seven percent of Central American immigrants reported speaking only English at home compared to 17 percent of the total foreign-born population. Panamanians stood out for being an exception to this trend: 21 percent reported speaking only English at home.
Age, Education, and Employment
In 2023, 80 percent of Central American immigrants were of working age (18 to 64), higher than the share of all immigrants (76 percent) or U.S. natives (58 percent). Central American immigrants were less likely to be minors (10 percent) or seniors over age 65 (10 percent) than the U.S. born (24 percent and 18 percent, respectively; see Figure 3).
Figure 3. Age Distribution of the U.S. Population, by Origin, 2023
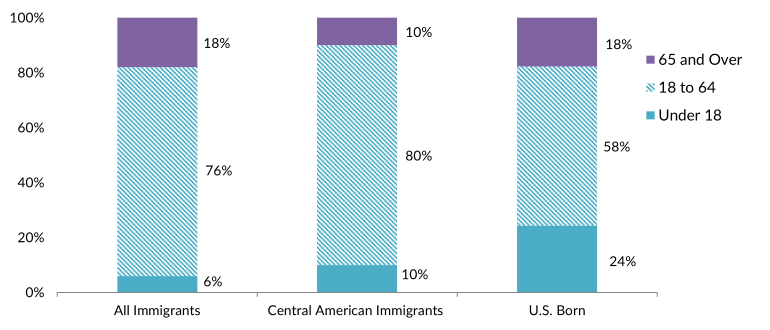
Note: Percentages may not add up to 100 as they are rounded to the nearest whole number.
Source: MPI tabulation of data from the U.S. Census Bureau’s 2023 ACS.
About 46 percent of Central Americans ages 25 and older lacked a high school diploma, versus 25 percent of all foreign-born adults and 7 percent of U.S.-born adults, as of 2023. More than half of Guatemalan immigrant adults (55 percent) lacked a high school education, the lowest educational attainment rate among Central American immigrants, followed by 49 percent of Salvadoran adults and 48 percent of Hondurans. Meanwhile, 12 percent of Central American immigrants had a bachelor’s degree or higher, well below the rates of the total immigrant (35 percent) and U.S.-born (36 percent) adult populations (see Figure 4).
Figure 4. Educational Attainment of the U.S. Population (ages 25 and older), by Origin, 2023
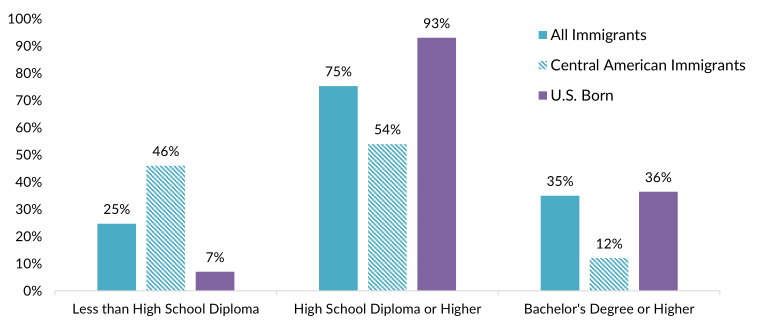
Note: Percentages may not add up to 100 as they are rounded to the nearest whole number.
Source: MPI tabulation of data from the U.S. Census Bureau 2023 ACS.
Click here for data on immigrants’ educational attainment by country of origin and overall.
Nearly 10,000 students from Central America were enrolled in U.S. higher education institutions during the 2023-24 academic year, according to the Institute of International Education, making up a small portion of the 1.1 million international students in the country overall. They accounted for 12 percent of the approximately 86,000 students from Latin America and the Caribbean studying in the United States.
Central American immigrants had a civilian labor force participation rate of 73 percent, significantly higher than that of both the overall foreign-born (67 percent) and U.S.-born (63 percent) populations. Within this group, Guatemalans and Salvadorans (74 percent each) and Hondurans (73 percent) had the highest participation rates, while immigrants from Panama had the lowest (58 percent).
Most Central American immigrants were employed in service (30 percent); natural resources, construction, and maintenance (25 percent); or production, transportation, and material moving (19 percent) occupations. In comparison, the leading occupational category for all immigrant workers was management, business, science, and arts (38 percent), followed by service work (21 percent).
Figure 5. Employed Workers in the Civilian Labor Force (ages 16 and older) by Occupation and Origin, 2023
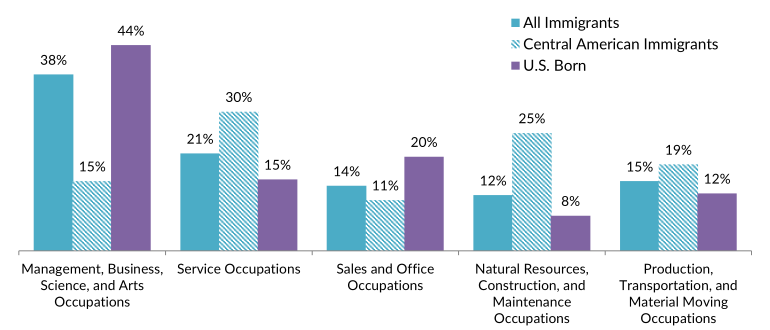
Note: Percentages may not add up to 100 as they are rounded to the nearest whole number.
Source: MPI tabulation of data from the U.S. Census Bureau’s 2023 ACS.
The median household income for Central Americans was about $64,000 in 2023, which was lower than that of either the overall immigrant population (nearly $79,000) and U.S.-born households ($78,000). Among Central Americans, immigrants from Costa Rica ($74,000) reported the highest median household income, followed by households led by Panamanians ($72,000) and Salvadorans ($71,000). In contrast, Hondurans ($51,000) and Guatemalans ($61,000) had the lowest median household incomes.
In 2023, 19 percent of Central Americans lived below the poverty line, compared to 14 percent of all immigrants and 12 percent of U.S.-born residents. Poverty rates were highest among Hondurans (27 percent) and Guatemalans (20 percent) and lowest among Panamanians (11 percent). (The U.S. Census Bureau defines poverty as having an income below $30,900 for a family of four in 2023.)
Immigration Pathways and Naturalization
As of 2023, about 32 percent of Central American immigrants were naturalized U.S. citizens, compared to 52 percent of immigrants overall. Panamanians (74 percent), Costa Ricans (54 percent), and Nicaraguans (46 percent) were more likely to be naturalized, while lower shares of Hondurans (19 percent), Guatemalans (25 percent), and Salvadorans (36 percent) had become U.S. citizens.
One factor contributing to Central Americans’ lower naturalization rates is the general recency of their residence in the United States. While 35 percent of all immigrants arrived in 2010 or later years, 43 percent of Central Americans did so (see Figure 6). Notably, most Honduran (80 percent) and Guatemalan (73 percent) immigrants arrived after 2000. In contrast, 70 percent of Panamanians entered the country before 2000. Another important factor explaining the lower levels of naturalization is that a significant share of Central Americans arrived in the United States without authorization, and migrants who crossed the border without authorization for the most part are not eligible for permanent residency and citizenship.
Figure 6. Central Americans and All Immigrants in the United States, by Period of Arrival, 2023
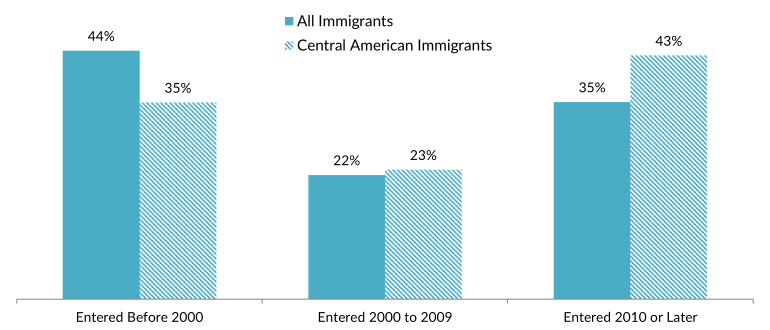
Note: Percentages may not add up to 100 as they are rounded to the nearest whole number.
Source: MPI tabulation of data from the U.S. Census Bureau’s 2023 ACS.
Nearly two-thirds (63 percent) of the 64,100 immigrants from Central America who became lawful permanent residents in FY 2023 did so through family reunification channels. About 15 percent obtained a green card though employment sponsorship and 14 percent did so after being resettled as a refugee or being granted asylum.
Most nationals of Belize (93 percent) and Panama (85 percent) receiving green cards in FY 2023 did so via family reunification. Guatemalans and Hondurans (17 percent each) were more likely than other Central Americans to become LPRs through employment. Guatemalans were also most likely to obtain green cards through humanitarian protection pathways (18 percent).
Unauthorized Immigrant Population
The Migration Policy Institute (MPI) estimates that about 3.8 million (28 percent) of all 13.7 million unauthorized immigrants in the United States as of mid-2023 were from Central America. The top origin countries for unauthorized immigrants from Central America were Guatemala (1.4 million) and Honduras and El Salvador (about 1.1 million each). (Note: MPI estimates of the size of the unauthorized immigrant population account for potential Census Bureau undercounts of the overall immigrant population; therefore, the unauthorized estimates included here are somewhat higher than the publicly available American Community Survey [ACS] data used elsewhere in this Spotlight.)
Click here for an MPI overview of the unauthorized immigrant population in the United States as of mid-2023.
Many migrants from these countries have remained in the United States with Temporary Protected Status (TPS), which grants work authorization and relief from deportation. El Salvador, Honduras, and Nicaragua were among the 15 countries with TPS designations as of this writing, although the Trump administration is seeking to end many of these designations (though has not announced an intent to do so for El Salvador). TPS protections covered approximately 180,400 Salvadorans as of September 2024. According to July 2025 government estimates, TPS covered about 72,000 Hondurans and 4,000 Nicaraguans.
Central Americans also account for one of the largest shares of Deferred Action for Childhood Arrivals (DACA) recipients, after Mexicans. DACA provides temporary deportation relief and work authorization to unauthorized immigrants who arrived as children and who meet the program’s education and other eligibility criteria. As of December 2024, an estimated 51,300 Central Americans had DACA status, representing 10 percent of all 533,300 active DACA recipients. Among these were 21,100 Salvadorans, 14,300 Guatemalans, and 13,100 Hondurans.
Click here to view the top origin countries of DACA recipients and their U.S. states of residence.
Central American immigrants are less likely than immigrants overall to have health insurance, with 40 percent lacking coverage compared to 18 percent of all immigrants and 6 percent of U.S. natives as of 2023 (see Figure 7). Hondurans (54 percent) and Guatemalans (47 percent) were the most likely to lack insurance, while the least likely were immigrants from Panama (6 percent).
Figure 7. Health Coverage for Central American Immigrants, All Immigrants, and the U.S. Born, 2023
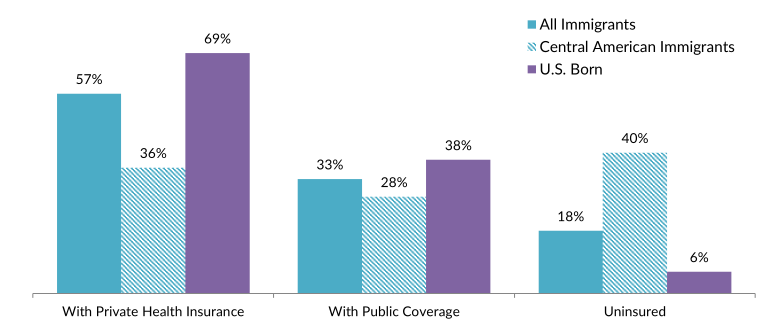
Note: The sum of shares by type of insurance is likely to be greater than 100 because people may have more than one type of insurance.
Source: MPI tabulation of data from the U.S. Census Bureau’s 2023 ACS.
The Central American diaspora is comprised of close to 7.6 million U.S. residents who were either born in Central America or reported Central American ancestry, according to MPI tabulation of data from the U.S. Census Bureau’s 2023 American Community Survey. The Salvadoran diaspora is the largest from the region (with close to 3 million members), followed by more than 2.3 million U.S. residents who have links to Guatemala and 1.6 million with ties to Honduras.
Click here to see estimates of the 35 largest diasporas groups in the United States in 2023.
While the United States is a major destination, many Central American migrants opt for locations such as Mexico and elsewhere in Central America, due to their proximity, cultural similarities, and relatively low cost of living. Spain, Portugal, and Canada are also popular choices.
Click here to view an interactive map showing where migrants from countries in Central America and other countries have settled worldwide.
Migrants and other individuals worldwide sent approximately $43.1 billion in remittances via formal channels to Central American countries in 2023, a nearly 13-fold increase over 2000, according to World Bank data. The share of remittances in each country's gross domestic product (GDP) varied significantly, accounting for less than 1 percent in Costa Rica and Panama in 2023 but reaching 24 percent in El Salvador and 26 percent in Honduras.
Figure 8. Annual Remittance Flows to Central America, 2000-23
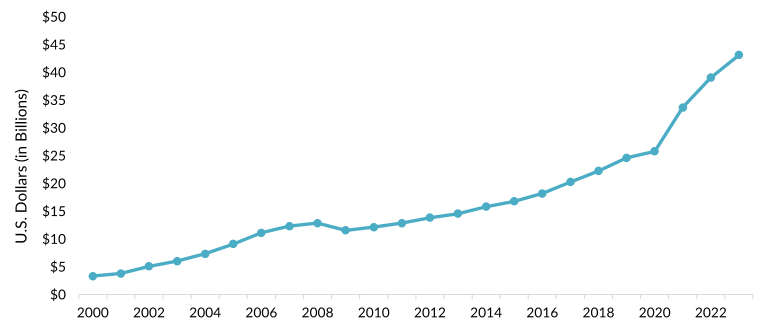
Source: MPI tabulation of data from the World Bank Global Knowledge Partnership on Migration and Development (KNOMAD), “Remittance Inflows,” updated April 15, 2025, available online.
Click here to view an interactive chart showing annual remittances received and sent by Central Americans and other regions.
Sources:
Gibson, Campbell J. and Kay Jung. 2006. Historical Census Statistics on the Foreign-Born Population of the United States: 1850-2000. Working Paper no. 81, U.S. Census Bureau, Washington, DC, February 2006. Available online.
Institute of International Education (IIE). N.d. International Students: All Places of Origin. Accessed June 15, 2025. Available online.
Knowledge Partnership on Migration and Development (KNOMAD)/World Bank Group. 2025. Annual Remittances Data. Updated April 15, 2024. Available online.
Ruiz Soto, Ariel G. 2022. Record-Breaking Migrant Encounters at the U.S.-Mexico Border Overlook the Bigger Story. Migration Policy Institute (MPI) commentary, October 2022. Available online.
UN Population Division. N.d. International Migrant Stock 2024 by Destination and Origin. Accessed June 29, 2025. Available online.
U.S. Census Bureau. 2024. 2023 American Community Survey. Access from Steven Ruggles, Sarah Flood, Matthew Sobek, Daniel Backman, Annie Chen, Grace Cooper, Stephanie Richards, Renae Rodgers, and Megan Schouweiler. IPUMS USA: Version 15.0 [dataset]. Minneapolis, MN: IPUMS, 2024. Available online.
---. N.d. 2023 American Community Survey—Advanced Search: S0201 Selected Population Profile in the United States. Accessed July 10, 2025. Available online.
U.S. Citizenship and Immigration Services (USCIS). 2025. Count of Active DACA Recipients by Month of Current DACA Expiration as of December 31, 2024. Updated February 2025. Available online.
---. 2025. Termination of the Designation of Honduras for Temporary Protected Status, Federal Register 90 (128): 30089-92, July 8, 2025. Available online.
---. 2025. Termination of the Designation of Nicaragua for Temporary Protected Status, Federal Register 90 (128): 30086-89, July 8, 2025. Available online.
U.S. Customs and Border Protection (CBP). 2025. National Border Encounters. Accessed August 1, 2025. Available online.
U.S. Department of Homeland Security (DHS), Office of Homeland Security Statistics (OHSS). 2024. 2023 Yearbook of Immigration Statistics. Washington, DC: DHS OHSS. Available online.
Wilson, Jill H. 2024. Temporary Protected Status and Deferred Enforced Departure. Washington, DC: Congressional Research Service. Available online.