


College-Educated Immigrants in the United States

A scientist at the SLAC National Accelerator Laboratory. (Photo: U.S. Department of Energy)
An underappreciated recent U.S. immigration trend is the rising number of immigrants who hold university-level degrees. This is particularly the case for recently arrived immigrants: 48 percent of those coming to the United States within the 2018-22 period had a college degree. The immigrant population overall slightly outperforms on educational attainment, representing 17 percent of all college-educated adults ages 25 and older in the United States, even as they were slightly less than 14 percent of the total U.S. population as of 2022.
Some college-educated immigrants come to the United States on temporary visas for high-skilled workers and researchers, as family members of U.S. residents, humanitarian migrants, or via other paths. Others obtain their education once already in the United States. Thirty-five percent of all immigrant adults (14.1 million people) had a bachelor’s degree or higher as of 2022, roughly similar to the 36 percent of all U.S.-born adults (67.8 million) who graduated college.
The number of college-educated U.S. immigrants has grown rapidly since 1990. This population increased by 89 percent between 1990 and 2000, 55 percent between 2000 and 2010, and 56 percent between 2010 and 2022 (see Figure 1). The native-born college-educated population also has grown, but at a slower pace, by 32 percent, 26 percent, and 40 percent, respectively. The faster growth of the high-skilled immigrant population means that their share of all college-educated adults in the United States also has increased over the last three decades, from 10 percent in 1990 to 17 percent in 2022.
Figure 1. Number of College-Educated Adults (ages 25 and older) in the United States, by Nativity, 1990-2022

Notes: Figure refers to adults with at least a bachelor’s degree.
Sources: Migration Policy Institute (MPI) analysis of data from the U.S. Census Bureau’s 1990 and 2000 Decennial Census and 2010 and 2022 American Community Survey (ACS), available online.
In 2022, immigrants accounted for 18 percent of all civilian employed workers. However, they were a much higher shares of workers in occupations that typically require a college degree, including representing 44 percent of computer hardware engineers, 34 percent of computer and information research scientists, and 29 percent of physicians.
This Spotlight provides a demographic and socioeconomic profile of the U.S.- and foreign-born population with a bachelor’s degree or higher, and highlights recent trends in and characteristics of H-1B specialty occupation workers and international students.
Click on the bullet points below for more information:
- Geographic Distribution
- Age, Race and Ethnicity, and Country of Origin
- English Proficiency and Education
- Employment and Occupation
- Brain Waste
- Income and Poverty
- H-1B Specialty Occupation Workers
- International Students
Thanks to its labor market mix and well-known universities and research centers, California had the largest number of immigrants with college degrees, with approximately 3.1 million (or 22 percent of all college-educated immigrants in the United States) in 2022. Florida, Texas, and New York were each home to about 1.4 million (10 percent; see Table 1). These four states accounted for 51 percent of the 14.1 million immigrant college graduates in the country. The next six states—New Jersey (6 percent); Illinois (4 percent); and Virginia, Washington, Massachusetts, and Maryland (about 3 percent apiece)—accounted for another 22 percent combined.
Table 1. Top U.S. States for College-Educated Immigrants, 2022
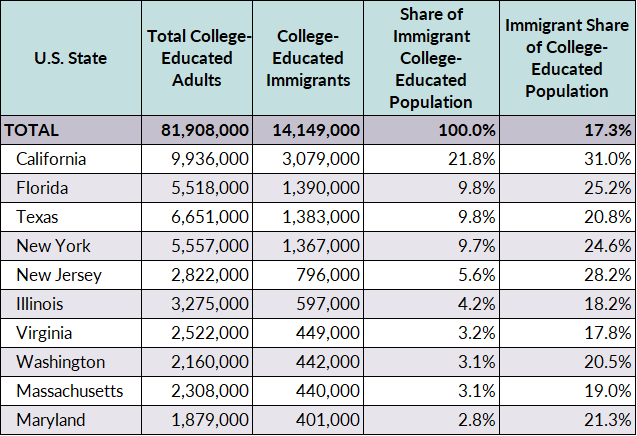
Source: U.S. Census Bureau 2022 ACS.
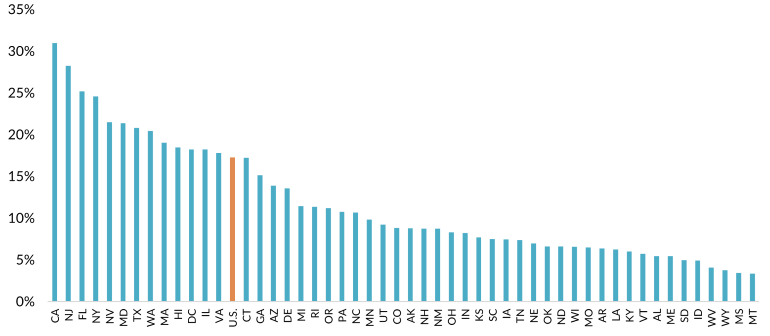
While immigrants comprised 17 percent of all college-educated adults nationally, their share was much higher in California (31 percent), New Jersey (28 percent), New York and Florida (25 percent each), and Nevada, Maryland, and Texas (21 percent; see Figure 2).
Figure 2. Immigrant Share of U.S. College-Educated Adults (ages 25 and older), by State, 2022
Source: U.S. Census Bureau 2022 ACS.
Age, Race and Ethnicity, and Country of Origin
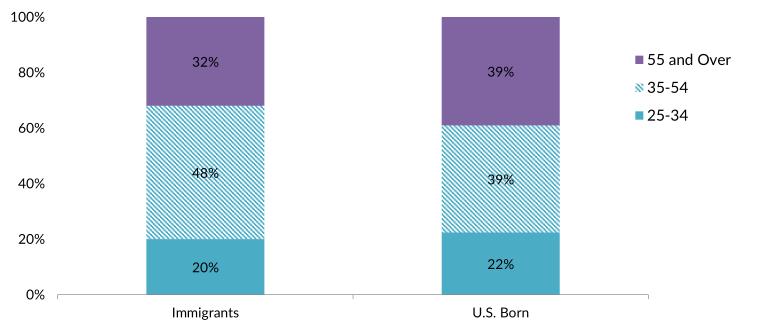
Immigrant college graduates tend to be younger and are more likely to be of prime working age (25 to 54) than their native-born counterparts. In 2022, 68 percent of college-educated immigrants were younger than 55 years old, compared to 61 percent of those born in the United States (see Figure 3).
Figure 3. Age Distribution of U.S. College-Educated Adults (ages 25 and older), by Nativity, 2022
Source: MPI tabulation of data from the U.S. Census Bureau 2022 ACS.
Non-Latino Asian American and Pacific Islander (AAPI) immigrants accounted for 46 percent of all college-educated immigrants, followed by non-Latino Whites (23 percent) and Latinos of all races (20 percent). In contrast, an overwhelming majority of native-born, college-educated individuals were non-Latino White (78 percent), while minorities, particularly AAPI and Latino adults, were under-represented (see Figure 4).
Figure 4. U.S. College-Educated Foreign- and Native-Born Adults (ages 25 and older), by Race and Ethnicity, 2022

Notes: Latino includes all individuals who identified as Latino, regardless of race. Non-Latino Black refers to those who identified as “Black alone” or in combination with other races. Asian American and Pacific Islander includes people who identified as Asians or Pacific Islanders alone or in combination with other races, excluding non-Latino Black. Non-Latino White refers to those who reported either “White only” or “other race and White.” American Indian/Other includes individuals who identified as "other race only” or “unspecified multiracial.”
Source: MPI tabulation of data from the U.S. Census Bureau 2022 ACS.
In 2022, the top countries of origin for all college-educated immigrants were India (14 percent), China (including Hong Kong; about 8 percent), the Philippines (7 percent), and Mexico (6 percent; see Table 2). These countries were among the top senders of immigrant college graduates who arrived from 2018 to 2022, but a larger share came from India (20 percent) while Venezuela was a larger origin than the Philippines (5 percent versus 4 percent). Japan and Ukraine were among the top 20 countries for recently arrived college-educated immigrants, but they were not on the overall list for the countries with the most immigrant college graduates in the United States.
Table 2. Top Countries of Birth for All U.S. College-Educated Immigrants and Recent Arrivals (ages 25 and older), 2022

Source: MPI tabulation of data from the U.S. Census Bureau 2022 ACS.
English Proficiency and Education
College-educated immigrants are likely to be proficient in English, with 74 percent reporting speaking only English or speaking English “very well” in 2022. They also tend to be much more proficient in spoken English than immigrant adults without a four-year college degree (41 percent in 2022).
Highly skilled immigrants are more likely to have advanced degrees than their U.S.-born counterparts. In 2022, 15 percent of immigrant college graduates held professional or doctoral degrees, compared to 11 percent of their U.S.-born counterparts. Both groups were roughly equally likely to have a master’s degree (30 percent for the foreign born and 28 percent for the native born).
Click here for data on immigrants’ educational attainment by country of origin and overall.
Regardless of nativity, most college-educated adults have spouses who are also highly educated. However, immigrant college graduates are more likely to have college-educated spouses than their U.S.-born counterparts. Seventy percent of college-educated immigrant adults and 63 percent of their U.S.-born peers in 2022 were married to people with a bachelor’s degree or higher (see Figure 5).
Figure 5. Educational Attainment of Spouses of College-Educated U.S. Residents (ages 25 and above), by Nativity, 2022
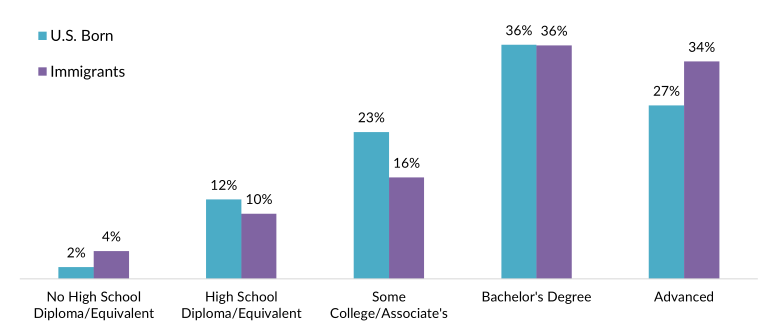
Note: Figure refers to married college-educated heads of households ages 25 and older with spouses present at home. Spouses can be of any age.
Source: MPI tabulation of data from the U.S. Census Bureau 2022 ACS.
College-educated immigrants’ rate of civilian labor force participation was quite similar to that of their native-born counterparts (75 percent and 73 percent, respectively) in 2022. Both groups were more likely to participate in the labor force than peers without a college degree (63 percent and 57 percent, respectively). Unemployment rates in general were low in 2022. College-educated immigrants were approximately as likely to be unemployed as their native-born counterparts that year (3 percent and 2 percent, respectively); among adults without college degrees, the unemployment rate was about 4 percent regardless of nativity.
College-educated immigrant workers are more likely than their native-born counterparts to be in high-tech, science, and engineering occupations. In 2022, 13 percent of college-educated immigrants were employed in computer and mathematics occupations, versus 6 percent of their U.S.-born counterparts. The top five occupational groups for immigrant college graduates were management (16 percent), computer and mathematical occupations (13 percent), health practitioners and technicians (11 percent), business and financial operations (10 percent), and education and related occupations (9 percent). For U.S.-born college graduates, the top five occupation groups were management (18 percent), education and related occupations (13 percent), business and financial operations (11 percent), health practitioners and technicians (11 percent), and sales and related occupations (7 percent).
Although immigrants accounted for 18 percent of total civilian employed workers in 2022, they represented much higher shares of college-educated workers in certain occupational groups such as health-care support and computer and mathematics occupations (see Table 3).
Table 3. Employed Foreign-Born College-Educated Workers (ages 25 and older), by Occupational Group, 2022

Source: MPI tabulation of data from the U.S. Census Bureau 2022 ACS.
In 2022, approximately 2.1 million college-educated immigrants in the U.S. labor market (around 20 percent of college-educated immigrants) were either unemployed or working in low-skilled jobs including as dishwashers, security guards, or taxi drivers, often because of difficulty getting their credentials recognized or other hurdles. This situation represents a waste of human capital (also referred to as “brain waste” or underemployment) that also affects approximately 7.8 million U.S.-born college graduates (16 percent of U.S.-born graduates).
Click here to view the number and share of immigrant and U.S.-born college graduates who were underemployed in the United States and by state in 2022.
Click here to view MPI’s resources on brain waste and the employment pathways of skilled immigrants.
Overall, the median household income of college-educated immigrants was slightly larger than that of their U.S.-born counterparts ($122,000 versus $113,000) in 2022. However, college-educated immigrants were more likely to be in poverty (7 percent versus 4 percent) due to a combination of factors including larger family size and a higher level of underemployment. In contrast, 14 percent of the total foreign-born population and 12 percent of the total native-born population lived in poverty. (The U.S. Census Bureau defines poverty as having an income below $29,700 for a family of four in 2022.)
H-1B Specialty Occupation Workers
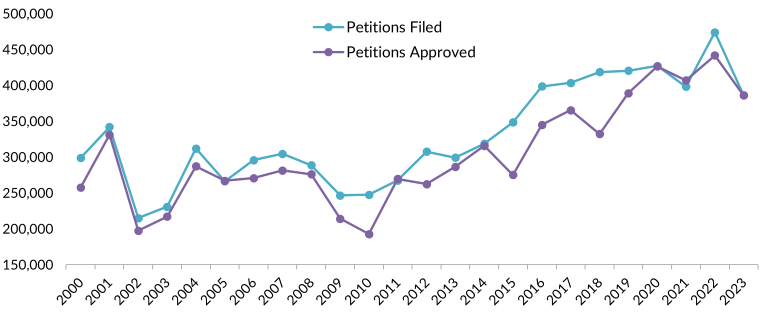
The number of total H-1B petitions (for both initial and continuing employment) filed and approved has fluctuated over the last 15 years in response to economic trends and policy changes (see Figure 6). Recessions in 2001 and 2008 as well as the COVID-19 pandemic, for instance, decreased demand for H-1B workers in following years. When the economy rebounds, U.S. employers typically petition for a higher number of visas.
Figure 6. H-1B Petitions Filed and Approved, FY 2000-23
Notes: Figure refers to approved petitions regardless of when filed. The data exclude about 63,000 petitions submitted but not selected in the computer-generated random lottery in April 2008.
Source: Department of Homeland Security (DHS), Characteristics of Specialty Occupation Workers (H-1B) (Washington, DC: DHS, various years).
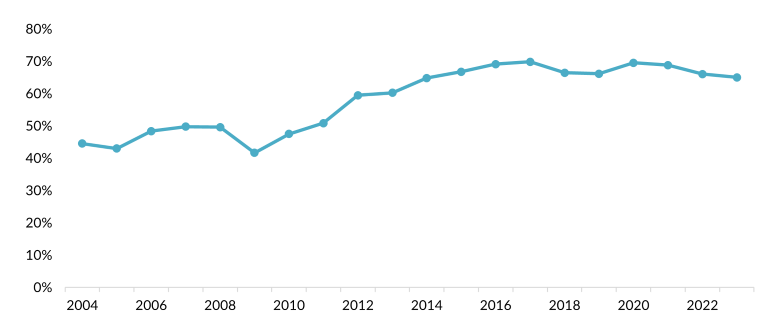
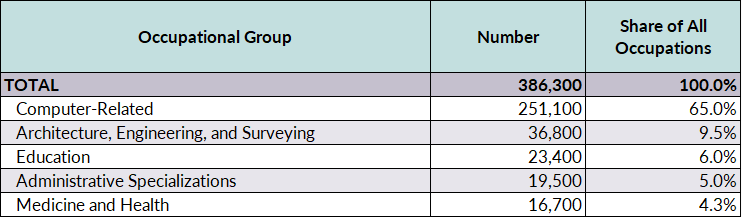
The H-1B program has been primarily used by information-technology companies, and the share of computer-related workers among all approved H-1B petitions has increased significantly since 2010, reaching a high of 70 percent in 2017, and remaining generally above 65 percent (see Figure 7). Close to two-thirds of approved H-1B petitions (251,000) in fiscal year (FY) 2023 were for workers in computer-related occupations, mainly systems analysts and programmers.
Figure 7. Share of Computer-Related Workers among All Approved H-1B Petitions, FY 2004-23
Source: DHS, Characteristics of Specialty Occupation Workers (H-1B), various years.
As of FY 2023, other top occupational groups of beneficiaries with approved H-1B petitions included those in architecture and engineering, education, administrative services, and medical fields (including physicians and surgeons; see Table 4).
Table 4. Top Occupational Groups of Beneficiaries with Approved H-1B Petitions, FY 2023
Source: DHS, Characteristics of H-1B Specialty Occupation Workers: Fiscal Year 2023 Annual Report to Congress (Washington, DC: DHS, 2024), available online.
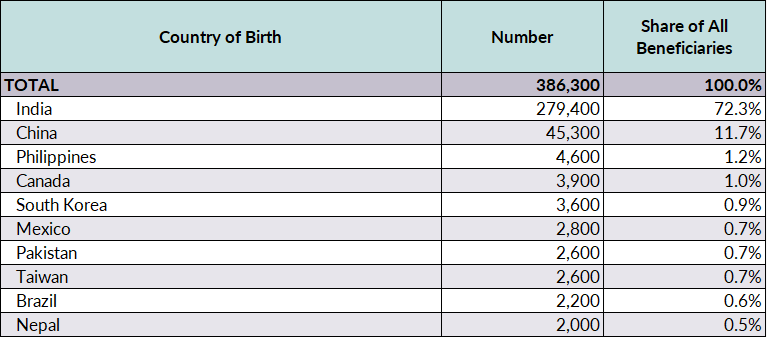
In FY 2023, more than 72 percent of approved H-1B petitions were for workers from India, followed by those from China (nearly 12 percent), and the Philippines and Canada (about 1 percent apiece; see Table 5). Together with South Korea, Mexico, Pakistan, Taiwan, Brazil, and Nepal, the top ten countries of origin accounted for 90 percent of all 386,300 approved petitions.
Table 5. Top Origin Countries of Beneficiaries with Approved H-1B Petitions, FY 2023
Source: DHS, Characteristics of H-1B Specialty Occupation Workers: Fiscal Year 2023 Annual Report to Congress.
The number of international students enrolled in U.S. higher education institutions has more than doubled since 1990, from 408,000 in the 1990-91 school year to 1,057,000 in 2022-23, according to the Institute of International Education. Over this period, the share of international students enrolled in U.S. higher education grew from 2.9 percent to 5.6 percent.
The total number of international students has fluctuated in the past decade, rising from 886,000 in 2013-14 to nearly 1.1 million in 2018-19, then falling to 914,000 in 2020-21, in part due to the pandemic and greater restrictions from the Trump administration. International students graduating from their U.S. programs are eligible to receive optional practical training (OPT) which allows them to gain U.S. work experience related to their field of study. In 2022-23, about 19 percent of all international students were on OPT, down from 22 percent in 2020-21 but much higher than the 12 percent in 2013-14. OPT is a period during which undergraduate and graduate students with F-1 (foreign student) status who have completed or have been pursuing their degrees for more than nine months are permitted to work. Most F-1 international students are entitled to a 12-month OPT, and those who studied in qualifying STEM fields are eligible for a 24-month extension.
Asia is the primary sending region of international students in the United States. In the 2022-23 school year, the 748,000 students from Asia accounted for 71 percent of the nearly 1.1 million international students enrolled in U.S. higher education institutions. Mainland China (290,000 students, or 27 percent of all international students) and India (267,000, or 25 percent) accounted for more than half of all international students, with South Korea (44,000), Canada (28,000), and Vietnam and Taiwan (22,000 apiece) rounding the top six.
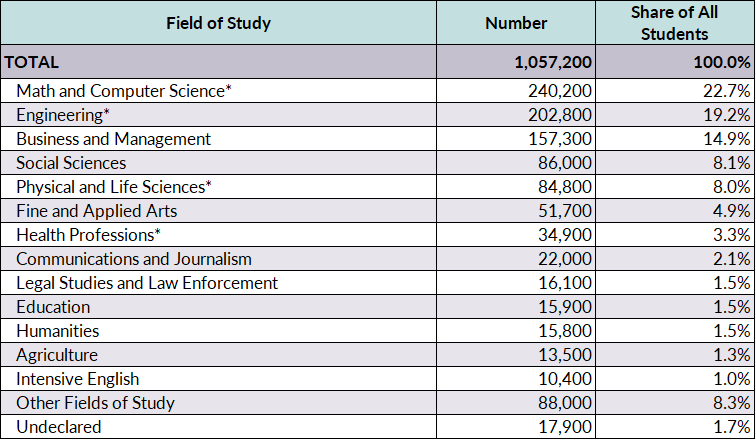
Math and computer science, engineering, and business and management were the most popular fields of study for international students in 2022-23. Together, they accounted for 57 percent of the total (see Table 6).
Table 6. International Students in the United States, by Field of Study, 2022-23
* Subject is considered a science, technology, engineering, or math (STEM) field according to the Institute of International Education (IIE).
Source: MPI tabulation of data from IIE, Fields of Study, 2022/23, Open Doors Report on International Educational Exchange (New York: IIE, 2023), available online.
Graduate students accounted for 44 percent (467,000) of all international students in 2022-23, followed by undergraduates (33 percent or 348,000) and nondegree students (4 percent or 44,000). Individuals pursuing OPT accounted for the remaining 19 percent. Between 2013-14 and 2022-23, the number of graduate students increased by 42 percent, while the number of undergraduates fell by 6 percent.
Sources
Institute of International Education (IIE). 2024. Open Doors Report on International Educational Exchange. New York: IIE. Available online.
Migration Policy Institute (MPI), Migration Data Hub. N.d. Educational Attainment of U.S. Adults (ages 25 and over) by Nativity and Country of Birth, 2022. Accessed September 9, 2024. Available online.
U.S. Census Bureau. 2024. 2022 American Community Survey. Access from Steven Ruggles, Sarah Flood, Matthew Sobek, Daniel Backman, Annie Chen, Grace Cooper, Stephanie Richards, Renae Rodgers, and Megan Schouweiler. IPUMS USA: Version 15.0 [dataset]. Minneapolis, MN: IPUMS, 2024. Available online.
---. N.d. 2022 American Community Survey—Advanced Search: B06009: Place of Birth by Educational Attainment in the United States. Accessed September 2, 2024. Available online.
U.S. Department of Homeland Security (DHS). 2023. 2022 Yearbook of Immigration Statistics. Washington, DC: DHS Office of Homeland Security Statistics. Available online.
---. 2024. Characteristics of H-1B Specialty Occupation Workers: Fiscal Year 2023 Annual Report to Congress. Washington, DC: DHS. Available online.