

Middle Eastern and North African Immigrants in the United States

An immigrant from Iraq living in Michigan. (Photo: Jetta Disco/DHS)
With wars and economic and social instability in many parts of the Middle Eastern and North African (MENA) region, the number of immigrants from MENA countries in the United States has been on the rise, growing nearly three times as fast between 2010 and 2022 as the overall U.S. immigrant population. Still, the 1.2 million MENA immigrants as of 2022 comprised less than 3 percent of all 46.2 million U.S. immigrants.
The history of immigration from the Middle East and North Africa to the United States is as multifaceted as the countries from which these migrants arrive, representing a diverse range of cultures, ethnicities, and religions. The earliest arrivals from the region were Africans brought to the United States as enslaved people as early as 1528, although there is little record of their history or numbers. The first significant modern immigration occurred during the 1800–1924 period, with arrivals from modern-day Israel, Lebanon, and Syria, which then were part of the Ottoman Empire. These immigrants were mostly Arab Christians who sought religious freedom and economic opportunities in the United States. By the time immigration from Asia and Africa was legally restricted by the 1924 Immigration Act (also known as the Johnson-Reed Act), there were between 50,000 and 200,000 immigrants in the United States from the MENA region.
The second modern immigration period began after World War II, the 1948 Arab-Israeli War, and revolutions in Egypt and Iraq in the 1950s. Immigrants in this period tended to be highly educated elites from Egypt, Iraq, and Syria. A significant number of people of varying socioeconomic status also arrived fleeing conflicts in the region. The passage of the 1965 Immigration and Nationality Act (also known as the Hart-Celler Act) ended the stringent national-origins quota system and opened pathways for non-European immigrants, including from the Middle East and North Africa. At the same time, the Lebanese Civil War and the Six-Day War of 1967 saw the arrival of many Lebanese and Palestinians, who tended to be highly educated.
Since the 1990s, the number of Iraqi and Sudanese immigrants in the United States has increased annually, many coming as refugees or seeking other humanitarian protections to escape conflict. The U.S. invasion of Iraq and the eventual rise of the Islamic State brought many Iraqis to the United States as resettled refugees, on Special Immigrant Visas (SIVs), or family-sponsored visas. The Arab Spring beginning in 2010, as well as the economic pressures that underpinned it, spurred migration from countries including Egypt, Jordan, and Morocco. Since then, humanitarian migration from war-torn Syria, Yemen, and elsewhere, as well as ongoing family reunification, have contributed to the rising number of MENA immigrants in the United States.
Compared to U.S. immigrants overall, those from the MENA region on average have higher educational attainment and are more likely to be proficient in English and be naturalized citizens. Their sectors of work tend to be more similar to those of U.S.-born workers than of the foreign born, with a relatively higher share working in management, business, science, and arts occupations. Yet MENA immigrants are more likely to live in poverty than other immigrants. They are also more likely to obtain U.S. lawful permanent residence (also known as a green card) via humanitarian protection or the Diversity Visa lottery than other immigrants.
This Spotlight provides information on the MENA immigrant population in the United States, focusing on its size, geographic distribution, and socioeconomic characteristics.
Click on the bullet points below for more information:
- Size of Immigrant Population over Time
- Countries of Origin
- Distribution by State and Key Cities
- English Proficiency and Language Diversity
- Age, Education, and Employment
- Income and Poverty
- Immigration Pathways and Naturalization
- Unauthorized Immigrant Population
- Health Insurance Coverage
- Diaspora
- Top Global Destinations
- Remittances
Size of Immigrant Population over Time
The U.S. MENA immigrant population has grown rapidly since the 1980s, more than doubling between 1980 and 2000 and again between 2000 and 2022 (see Figure 1). More recently, MENA immigrants have outpaced the growth of the total U.S. immigrant population between 2010 and 2022 (41 percent versus 16 percent). Still, the 1.2 million MENA immigrants represent a small share of the total U.S. immigrant population (3 percent as of 2022).
Figure 1. Middle Eastern and North African Immigrant Population in the United States, 1980–2022
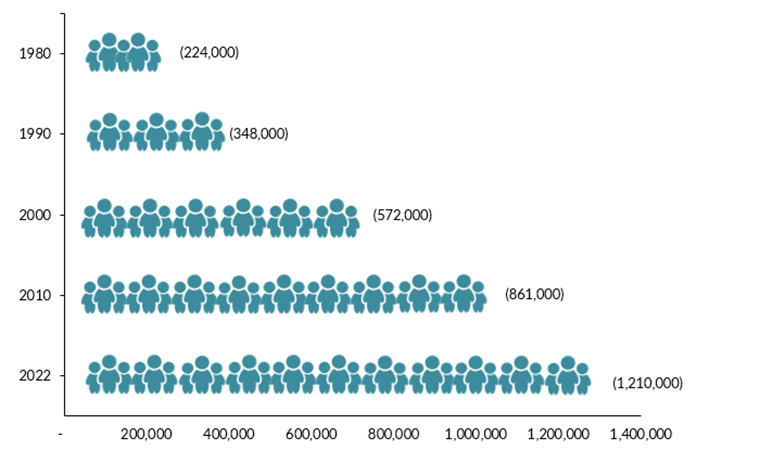
Source: Data from U.S. Census Bureau 2010 and 2022 American Community Surveys (ACS), and Campbell J. Gibson and Kay Jung, "Historical Census Statistics on the Foreign-Born Population of the United States: 1850-2000" (Working Paper no. 81, U.S. Census Bureau, Washington, DC, February 2006), available online.
Slightly more than 63 percent of MENA immigrants are from the Middle East, whereas 37 percent are from North Africa. Egypt and Iraq are the top countries of origin for MENA immigrants, followed by Lebanon, Syria, and Morocco (see Table 1).
Table 1. Middle Eastern and North African Immigrants in the United States, by Country of Origin, 2022

Source: Migration Policy Institute (MPI) tabulation of data from the U.S. Census Bureau 2022 ACS.
Distribution by State and Key Cities
More than 60 percent of all MENA immigrants in the United States resided in one of eight states during the 2018–22 period: California (18 percent), Michigan (11 percent), Texas (9 percent), New York (8 percent), and New Jersey, Florida, and Illinois (5 percent apiece). The top five counties for MENA immigrants—Los Angeles County, California; Wayne County, Michigan; Cook County, Illinois; San Diego County, California; and Macomb County, Michigan—together were home to nearly one-fifth of the total MENA immigrant population in the United States.
Figure 2. Top States of Residence for Middle Eastern and North African Immigrants in the United States, 2018–22

Notes: Pooled 2018–22 ACS data were used to get statistically valid estimates at the state level for smaller-population geographies. Not shown is the population in Alaska, which is small in size. For details, visit MPI’s Migration Data Hub for an interactive map showing the geographic distribution of immigrants by state and county, available online.
Source: MPI tabulation of data from the U.S. Census Bureau's pooled 2018–22 ACS.
Click here for an interactive map that highlights the states and counties with the highest concentrations of immigrants from the MENA region and other places of origin.
The U.S. cities with the largest shares of the MENA immigrant population were the greater New York (12 percent), Detroit (9 percent), and Los Angeles (7 percent) metropolitan areas. Combined, 28 percent of all MENA immigrants in the United States resided in one of these three metro areas.
Figure 3. Top Metropolitan Destinations for Middle Eastern and North African Immigrants in the United States, 2018–22

Notes: Pooled 2018–22 ACS data were used to get statistically valid estimates at the metropolitan statistical-area level for smaller-population geographies. Not shown are the populations in Alaska, which are small in size. For details, visit MPI’s Migration Data Hub for an interactive map showing geographic distribution of immigrants by metro area, available online.
Source: MPI tabulation of data from U.S. Census Bureau pooled 2018–22 ACS.
Click here to view an interactive map that highlights the metro areas with the highest concentrations of immigrants from the MENA region and elsewhere.
Table 2. Top U.S. Metropolitan Areas of Residence for Middle Eastern and North African Immigrants, 2018–2022
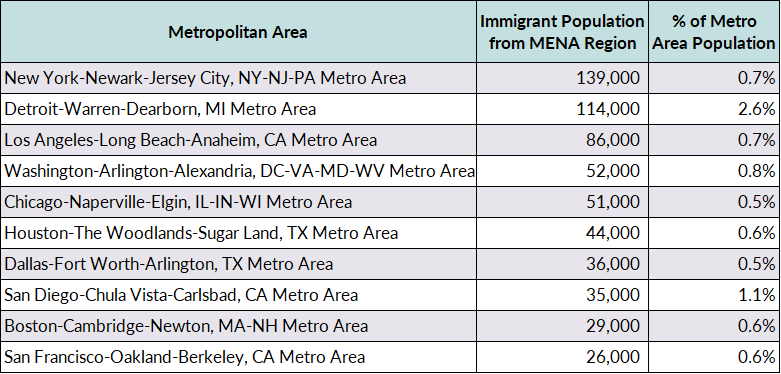
Source: MPI tabulation of data from the U.S. Census Bureau pooled 2018–22 ACS.
English Proficiency and Language Diversity
MENA immigrants are less likely to speak English at home than the overall foreign-born population, but they are more likely to be proficient in English. In 2022, about 11 percent of MENA immigrants spoke only English at home, versus 17 percent of the total immigrant population. At the same time, only 38 percent of MENA immigrants ages 5 and over reported speaking English less than “very well,” compared to 46 percent of all immigrants.
English proficiency varied by country of origin. In 2022, 63 percent of Yemeni, 47 percent of Iraqi, and 45 percent of Syrian immigrants reported limited English proficiency, versus 28 percent of Jordanian, 30 percent of Egyptian, and 32 percent of Lebanese immigrants.
In terms of languages spoken at home, 76 percent of MENA immigrants spoke either Arabic or the Near East Arabic dialect, while 11 percent reported speaking only English. Speakers of French and Armenian–the next top two languages–accounted for 4 percent and 2 percent of MENA immigrants, respectively.
Age, Education, and Employment
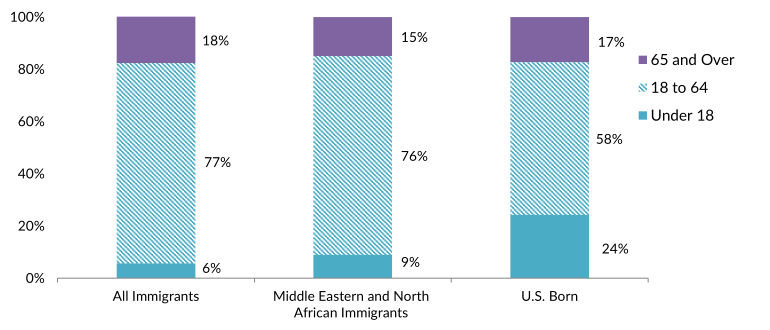
The age distribution of MENA immigrants is roughly similar to that of the total foreign-born population, with 76 percent between ages 18 and 64 in 2022 (see Figure 4). Both groups tend to be older than the U.S. born. The median age for MENA immigrants in 2022 was 44, whereas it was 47 for all immigrants and 37 for the U.S. born.
Figure 4. Age Distribution of the U.S. Population, by Origin, 2022
Note: Percentages may not add up to 100 as they are rounded to the nearest whole number.
Source: MPI tabulation of data from the U.S. Census Bureau 2022 ACS.
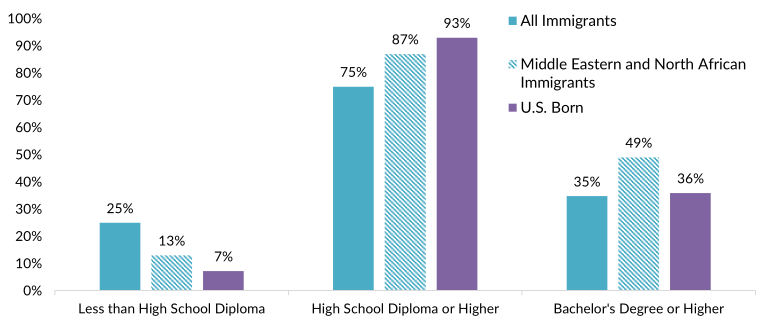
MENA immigrants are more likely to be college graduates than either immigrants overall or the U.S. born. In 2022, 49 percent of MENA immigrant adults (ages 25 and older) had a bachelor’s degree or higher level of education, compared to 35 percent of foreign-born adults and 36 percent of U.S.-born adults (see Figure 5). Educational attainment varies by origin. In 2022, 67 percent of Egyptians and 51 percent of Jordanians had at least a bachelor’s degree, compared to only 16 percent of Yemeni immigrants.
Figure 5. Educational Attainment of the U.S. Population (ages 25 and older), by Origin, 2022
Note: Percentages may not add up to 100 as they are rounded to the nearest whole number.
Source: MPI tabulation of data from the U.S. Census Bureau 2022 ACS.
Click here for data on immigrants’ educational attainment by country of origin and overall.
Many students from the MENA region choose to study in the United States. Almost 4 percent (39,500) of the nearly 1.1 million international students attending U.S. colleges and universities in the 2022–23 school year were from the region, according to the Institute of International Education. Students from the Middle East represented the vast majority of these students (82 percent), while students from North Africa accounted for 18 percent. Saudi Arabia was the largest origin country of MENA students (nearly 16,000 students), followed by Kuwait (5,400) and Egypt (4,200).
MENA immigrant adults (ages 16 and older) participated in the civilian labor force at a slightly higher rate (64 percent) than U.S.-born adults (62 percent) but at a slightly lower rate than all immigrants (67 percent). Larger shares of MENA immigrants were employed in management, business, science, and arts occupations (46 percent) or in sales and office occupations (20 percent) than of all immigrant workers (see Figure 6).
Figure 6. Employed Workers in the U.S. Civilian Labor Force (ages 16 and older), by Occupation and Origin, 2022
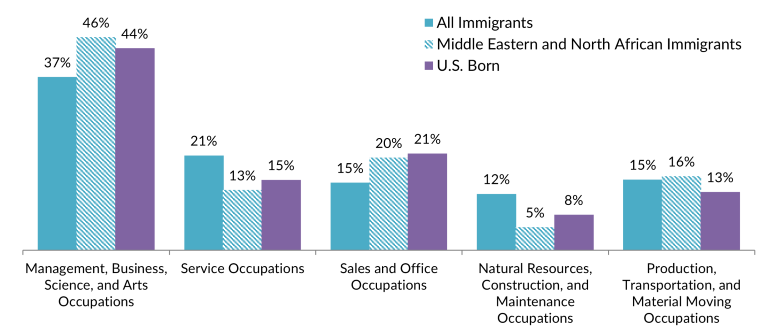
Note: Percentages may not add up to 100 as they are rounded to the nearest whole number.
Source: MPI tabulation of data from the U.S. Census Bureau 2022 ACS.
Occupational distribution varies considerably by country of origin. Higher shares of immigrants from Egypt and Lebanon were working in management, business, science, and arts occupations (55 percent and 53 percent, respectively), while Yemeni immigrants had a disproportionately high percentage of workers in the sales and office sector (36 percent).
MENA immigrants tended to have significantly lower household incomes than the total foreign- and native-born populations. In 2022, the median income of households headed by a MENA immigrant was $67,000, compared to $75,000 for both all immigrant and U.S.-born households.
Furthermore, 19 percent of MENA immigrants in 2022 lived in poverty, compared to 14 percent of all immigrants and 12 percent of the U.S. born. The share in poverty varied widely among countries of origin: 14 percent of Egyptian immigrants reported being in poverty in 2022, compared to 23 percent of Jordanians and 37 percent of Yemenis. (The U.S. Census Bureau defines poverty as having an income below $29,700 for a family of four in 2022.)
Immigration Pathways and Naturalization
Immigrants from MENA countries are more likely than the overall foreign-born population to be naturalized U.S. citizens. As of 2022, 68 percent of MENA immigrants were U.S. citizens, compared to 53 percent of the total foreign-born population.
MENA immigrants were also more likely than immigrants overall to have arrived recently, with 45 percent entering in 2010 or later versus 34 percent entering prior to 2000 (see Figure 7). This trend varies by country of origin. On the lower end of the distribution, 26 percent of Lebanese immigrants arrived in 2010 or later, compared to 57 percent of Yemeni immigrants.
Figure 7. Middle Eastern and North African and All Immigrants in the United States, by Period of Arrival, 2022

Note: Percentages may not add up to 100 as they are rounded to the nearest whole number.
Source: MPI tabulation of data from the U.S. Census Bureau 2022 ACS.
In fiscal year (FY) 2022, more than 45,400 MENA immigrants became lawful permanent residents (LPRs, also known as green-card holders), representing 4 percent of all new LPRs. MENA immigrants are more likely than all new LPRs to obtain their green card via humanitarian pathways or the Diversity Visa (DV) lottery, and are less likely to receive green cards through family reunification or employment (see Figure 8). In FY 2022, 12 percent of MENA immigrants obtained their green cards as refugees or asylees, and 19 percent through the DV program, compared to only 8 percent and 4 percent, respectively, of all new LPRs.
Figure 8. Immigration Pathways of Middle Eastern and North African and All Lawful Permanent Residents in the United States, FY 2022

Notes: Immediate Relatives of U.S. Citizens: Includes spouses, minor children, and parents of U.S. citizens. Family-Sponsored Preferences: Includes adult children and siblings of U.S. citizens as well as spouses and children of green-card holders. The Diversity Visa lottery was established by the Immigration Act of 1990 to allow entry to immigrants from countries with low rates of immigration to the United States. The law states that 55,000 diversity visas in total are made available each fiscal year. Individuals born in all countries in the Middle Eastern and North African region are eligible for the most recent DV 2025 lottery. Percentages may not add up to 100 as they are rounded to the nearest whole number.
Source: MPI tabulation of data from Department of Homeland Security (DHS), “Table 10D: Persons Obtaining Lawful Permanent Resident Status by Broad Class of Admission and Region and Country of Birth: Fiscal Year 2022,” updated August 21, 2023, available online.
Immigrants most likely to receive employment-based green cards were those from Oman (62 percent of Omani LPRs arrived via employment pathways), the United Arab Emirates (58 percent), and Qatar and Bahrain (45 percent each), although these were the origin countries of just 6 percent of all new MENA LPRs. Meanwhile, Syria (32 percent), Iraq and Egypt (29 percent each), and Sudan (27 percent) had the largest shares of immigrants who became LPRs by adjusting from refugee or asylee status. In contrast, 65 percent of Algerians and 46 percent of Moroccans who became LPRs in FY 2022 did so via the DV lottery.
Unauthorized Immigrant Population
The Migration Policy Institute (MPI) estimates that 45,000 unauthorized immigrants from MENA countries resided in the United States as of 2019, accounting for less than 0.5 percent of all 11 million unauthorized immigrants in the country.
Click here for an overview of the unauthorized immigrant population in the United States.
As of the end of 2023, 810 unauthorized immigrants from the MENA region were active participants in the Deferred Action for Childhood Arrivals (DACA) program, which provides temporary deportation relief and work authorization to individuals who arrived as children, according to U.S. Citizenship and Immigration Services (USCIS). These individuals represented a very small share of the nearly 530,100 DACA participants. The top MENA countries of origin for DACA participants were Jordan (150 recipients) and Saudi Arabia and the United Arab Emirates (120 each).
Click here to view the top origin countries of DACA recipients and their U.S. states of residence.
MENA immigrants were less likely to be uninsured than the total foreign-born population (10 percent versus 18 percent) in 2022 (see Figure 9). These immigrants were more likely to have private health insurance (55 percent) than public coverage (42 percent).
Figure 9. Health Coverage for Middle Eastern and North African Immigrants, All Immigrants, and the U.S. Born, 2022
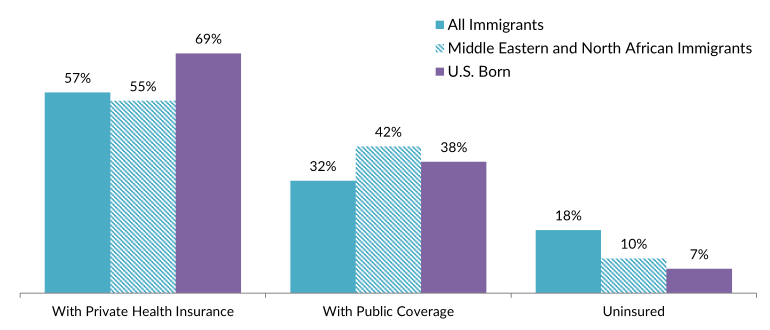
Note: The sum of shares by type of insurance is likely to be greater than 100 because people may have more than one type of insurance.
Source: MPI tabulation of data from the U.S. Census Bureau 2022 ACS.
The MENA diaspora population in the United States is comprised of approximately 2.6 million individuals who were either born in the MENA region or reported MENA ancestry, according to MPI tabulation of data from the U.S. Census Bureau’s 2022 American Community Survey (ACS).
Click here to see estimates of the top 35 diaspora groups in the United States in 2022.
Of the total 30.6 million MENA migrants worldwide in 2020, 46 percent (14.1 million) remained within the region, with Saudi Arabia (3.4 million), Jordan (3.3 million), and Lebanon (1.7 million) as the top regional destinations, according to mid-2020 estimates from the UN Population Division. Outside the region, Turkey is the largest destination (4 million), followed by France (3.3 million), and the United States and Germany (approximately 1.3 million each).
However, international settlement patterns vary considerably by country of origin. For example, of the 8.5 million Syrian migrants, 45 percent settled in Turkey, followed by Lebanon (12 percent) and Saudi Arabia (10 percent). Of the 3.6 million Egyptian international migrants, Saudi Arabia was the top destination (27 percent), followed by the United Arab Emirates (25 percent) and Kuwait (12 percent). Among the 2.1 million Iraqis abroad, the United States was the top destination (12 percent), followed by Turkey and Germany (11 percent each).
Click here to view an interactive map showing where immigrants from MENA and other countries have settled worldwide.
Global remittances to the MENA region sent via formal channels increased by 68 percent between 2010 and 2023, reaching U.S. $63.1 billion as of 2023, according to World Bank estimates (see Figure 10). Among MENA countries, Egypt received by far the most remittances, at $24.2 billion in 2023, followed by Morocco with $12.1 billion and Lebanon with $6.4 billion. Remittances represented a varying share of each country’s gross domestic product (GDP), ranging, for instance, from less than 1 percent for Algeria, Iraq, and Saudi Arabia to 10 percent for Jordan, 18 percent for Yemen, and 28 percent for Lebanon.
Figure 10. Annual Remittance Flows to Middle Eastern and North African Countries, 2000–23

Note: The 2023 figure is a World Bank estimate.
Source: MPI tabulation of data from the World Bank Global Knowledge Partnership on Migration and Development (KNOMAD), “Remittance Inflows,” December 2023 update, available online.
Sources
Arab American National Museum. N.d. Coming to America. Accessed June 7, 2024. Available online.
Ex Parte Mohriez, 54 F. Supp. 941. 1944. U.S. District Court for the District of Massachusetts. Available online.
Gibson, Campbell J. and Kay Jung. 2006. Historical Census Statistics on the Foreign-Born Population of the United States: 1850-2000. Working Paper no. 81, U.S. Census Bureau, Washington, DC, February 2006. Available online.
Guest, Andrew. 2022. Celebrating the History and Contributions of Arab Americans. Berkeley Extension Voices blog post, April 4, 2022. Available online.
Institute of International Education (IIE). 2023. International Students: All Places of Origin. Washington, DC: IIE. Available online.
Knowledge Partnership on Migration and Development (KNOMAD)/World Bank Group. 2023. Annual Remittances Data, December 2023 update. Available online.
Stephan, Rita. 2021. The Story of Arab Americans’ Beginning in America—and the Quest for Fair Representation. U.S. State Department, April 30, 2021. Available online.
Suleiman, Michael W. 2001. History, Demography, and Identity. Washington, DC: Wilson Center. Available online.
United Nations Population Division. 2020. International Migrant Stock 2020: Destination and Origin. Available online.
U.S. Census Bureau. 2024. 2022 American Community Survey. Accessed from Steven Ruggles, Sarah Flood, Matthew Sobek, Daniel Backman, Annie Chen, Grace Cooper, Stephanie Richards, Renae Rodgers, and Megan Schouweiler. IPUMS USA: Version 15.0 [dataset]. Minneapolis, MN: IPUMS, 2024. Available online.
---. N.d. 2022 American Community Survey—Advanced Search. Accessed May 24, 2024. Available online.
U.S. Citizenship and Immigration Services (USCIS). 2024. Count of Active DACA Recipients by Country of Birth as of December 31, 2023. Updated March 2024. Available online.
U.S. Department of Homeland Security (DHS), Office of Immigration Statistics. 2024. 2022 Yearbook of Immigration Statistics. Washington, DC: DHS Office of Immigration Statistics. Available online.