

Immigrants from Asia in the United States

A family in San Francisco. (Photo: iStock.com/Fabiomichelecapelli)
Asia is the second largest region of origin for immigration to the United States, after Latin America, accounting for 31 percent (or 14.6 million) of all 47.8 million foreign-born residents as of 2023. After Mexico, the next three largest countries of origin for U.S. immigrants were in Asia: India (2.9 million), China (2.4 million), and the Philippines (2.1 million).
U.S. immigration from Asia has a long and complex history. Starting in the mid-19th century, immigrants from Asia came primarily from China, Japan, Korea, and the Philippines for agricultural and construction work. However, after a series of restrictions targeting first Chinese immigration (the 1882 Chinese Exclusion Act) and then immigration from everywhere but Northern and Western Europe (the National Origins Acts of 1921 and 1924), immigration from Asia quickly ground to a halt. It did not rebound until the 1965 Immigration and Nationality Act removed national-origin quotas.
Unlike those who immigrated in the 19th and early 20th centuries, post-1965 arrivals from Asia have been more diverse in terms of their reasons for moving, as well as their skills, education, origin countries, and languages. Generally speaking, immigrants from Asia tend to have larger incomes and higher educational attainment than either the U.S. born or the overall foreign-born population, and are more likely than other immigrants to have arrived since 2010.
While people from Asia accounted for just 6 percent of the unauthorized immigrant population in the United States, which the Migration Policy Institute (MPI) estimated stood at 13.7 million as of mid-2023, the number is on the rise. In fiscal year (FY) 2024, close to 236,000 migrants from China, India, Myanmar (also known as Burma), the Philippines, and Turkey were encountered by the U.S. Border Patrol, nearly 40 percent more than in FY 2022, and placing these five countries among the top 21 origins for migrants encountered at the border.
This Spotlight provides information on the immigrant population from Asia in the United States, focusing on its size, geographic distribution, and socioeconomic characteristics.
Click on the bullet points below for more information:
- Size of Immigrant Population over Time and by Country
- Distribution by State and Key Cities
- English Proficiency
- Race and Ethnicity
- Age, Education, and Employment
- Income and Poverty
- Immigration Pathways and Naturalization
- Unauthorized Immigrant Population
- Health Coverage
- Diaspora
- Top Global Destinations
- Remittances
Size of Immigrant Population Over Time and by Country
The immigrant population from Asia has grown steadily over the past four decades, though its growth rate has declined over time. The number of immigrants from Asia in the United States more than tripled from 1980 to 2000 and nearly doubled from 2000 to 2023 (see Figure 1). This population is increasing at a faster rate than the overall U.S. foreign-born population, growing 29 percent since 2010, compared to 20 percent for all immigrants.
Figure 1. Immigrant Population from Asia in the United States, 1980-2023

Source: Data from U.S. Census Bureau’s 2010 and 2023 American Community Surveys (ACS), and Campbell J. Gibson and Kay Jung, "Historical Census Statistics on the Foreign-Born Population of the United States: 1850-2000" (Working Paper no. 81, U.S. Census Bureau, Washington, DC, February 2006), available online.
Asian migration to the United States has been driven primarily by arrivals from South Eastern and Eastern Asia, with a boost from South Central Asia since 2010 (see Figure 2; the number of immigrants from South Central Asia rose sharply since 2000, partly due to the region’s inclusion of former Soviet Union countries such as Uzbekistan and Kazakhstan that were previously classified as Europe). Meanwhile, the number of immigrants from Western Asia in the United States has grown steadily, but at a slower rate.
Figure 2. Immigrant Population from Asia in the United States, by Region of Birth, 1980-2023
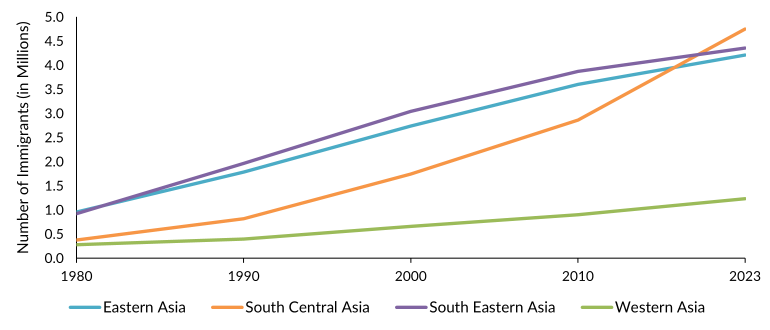
Notes: Eastern Asia includes China, Hong Kong, Japan, Macau, Mongolia, North Korea, South Korea, and Taiwan; South Central Asia includes Afghanistan, Bangladesh, Bhutan, India, Iran, Kazakhstan, Kyrgyzstan, the Maldives, Nepal, Pakistan, Sri Lanka, Tajikistan, Turkmenistan, and Uzbekistan; South Eastern Asia includes Brunei, Cambodia, Indonesia, Laos, Malaysia, Myanmar (Burma), the Philippines, Singapore, Thailand, Timor-Leste (East Timor), and Vietnam; Western Asia includes Armenia, Azerbaijan, Bahrain, Cyprus, Georgia, Iraq, Israel, Jordan, Kuwait, Lebanon, Oman, Qatar, Saudi Arabia, Syria, Turkey, the United Arab Emirates, and Yemen.
Source: Data from U.S. Census Bureau’s 2010 and 2023 ACS, and Campbell J. Gibson and Kay Jung, "Historical Census Statistics on the Foreign-Born Population of the United States: 1850-2000.”
In 2023, immigrants from India, China, the Philippines, Vietnam, and Korea represented 67 percent of all immigrants from Asia in the United States and 20 percent of all U.S. immigrants (see Table 1).
Table 1. Immigrants from Asia in the United States, by Region and Country of Origin, 2023

Note: Only countries with at least 100,000 immigrants are shown in the table.
Source: MPI tabulation of data from the U.S. Census Bureau, 2023 ACS.
The Migration Information Source offers Spotlights for immigrants in the United States from several Asian countries, India, China, the Philippines, Vietnam, Korea, and Afghanistan; some Asian countries are included in the Spotlight on the Middle East and North Africa.
Distribution by State and Key Cities
Thirty percent of immigrants from Asia lived in California in the 2019-23 period, making it their top state of residence. The states with the next largest numbers were New York (9 percent), Texas (8 percent), New Jersey (5 percent), and Illinois (4 percent). Together, these five states were home to 56 percent of immigrants from Asia.
The five counties with the greatest concentration of immigrants from Asia were Los Angeles County, California (8 percent); Santa Clara County, California (4 percent); Orange County, California and Queens County, New York (3 percent apiece), followed by Alameda County, California (2 percent). Together, these counties were home to 21 percent of the immigrant population from Asia.
Click here for an interactive map that highlights the states and counties with the highest concentrations of immigrants from Asia and other regions.
As of the 2019-23 period, five cities were home to 37 percent of all immigrants from Asia in the country. About 12 percent lived in each of the greater New York and Los Angeles metropolitan areas, followed by San Francisco (6 percent), then San Jose and Washington, DC (4 percent each; see Figure 3).
Figure 3. Top Metropolitan Destinations for Immigrants from Asia in the United States, 2019-23

Notes: Pooled 2019–23 ACS data were used to get statistically valid estimates at the metropolitan statistical-area level for smaller-population geographies. Not shown is the population in Alaska. For details, visit MPI’s Migration Data Hub for an interactive map showing geographic distribution of immigrants by metro area, available online.
Source: MPI tabulation of data from U.S. Census Bureau pooled 2019–23 ACS.
Click here for an interactive map that highlights the metro areas with the most immigrants from Asia and other regions.
In some cities, immigrants from Asia comprise substantial portions of the overall population. More than one-quarter of all residents of the greater San Jose metro area in the 2019-23 period were born in Asia, as were nearly one-fifth of all San Franciscans (see Table 2).
Table 2. Top U.S. Metropolitan Areas of Residence for Immigrants from Asia, 2019-23

Source: MPI tabulation of data from the U.S. Census Bureau pooled 2019-23 ACS.
Immigrants from Asia are more likely to be proficient in English but less likely to speak English at home than the overall foreign-born population. In 2023, 41 percent of immigrants from Asia ages 5 and above reported speaking English less than “very well,” compared to 47 percent of all immigrants. The immigrant groups most likely to speak English less than very well were from Myanmar (69 percent), Vietnam (65 percent), Cambodia (63 percent), Laos (62 percent), and Yemen (58 percent). Asian origins with the lowest share of limited English proficiency were Israel (17 percent), India (21 percent), Sri Lanka (22 percent), and the Philippines and Malaysia (29 percent each).
Approximately 13 percent of Asia-origin immigrants spoke only English at home, compared to close to 17 percent of all immigrants. The top ten foreign languages spoken by immigrants from Asia are Chinese (including Mandarin and Cantonese), Tagalog (including Filipino), Vietnamese, Korean, Hindi, Arabic, Telugu, Urdu, Persian (including Farsi and Dari), and Bengali.
For the most part, immigrants from Asia identify as Asian. About 85 percent in 2023 reported their race as non-Latino Asian, followed by 12 percent who identified as non-Latino White. Smaller shares reported other races: 3 percent as multiracial, and less than 0.5 percent each reported being non-Latino Black, Latino, or unspecified race.
This compares to the following racial and ethnic self-identification among the overall U.S. foreign-born population: In 2023, 45 percent reported being Latino, 27 percent non-Latino Asian/Pacific Islander, 16 percent non-Latino White, 9 percent non-Latino Black, 3 percent multiracial, and less than 1 percent reported some other race.
Age, Education, and Employment
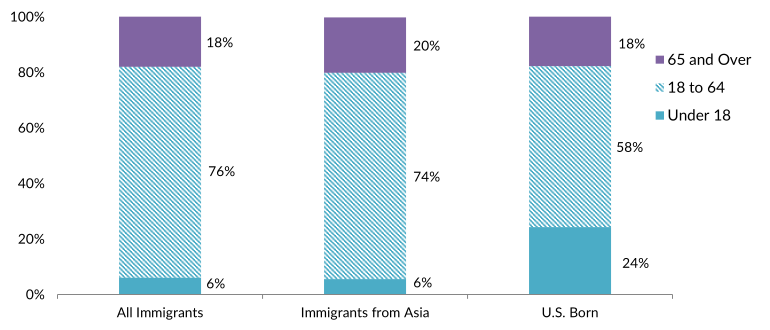
Immigrants from Asia tend to be older than the U.S.-born population and slightly older than the overall foreign-born population. The median age of Asia-origin immigrants in 2023 was about 48, compared to 47 for all immigrants and 37 for the native born. Like immigrants overall, those from Asia are more likely than the native born to be of working age (18 to 64 years old; see Figure 4).
The largest shares of working-age immigrants were from Nepal (89 percent), Turkey (84 percent), and Myanmar, India, and Bangladesh (81 percent apiece). Immigrants from Iran (32 percent), Taiwan (29 percent), Lebanon (28 percent), and the Philippines (27 percent) were most likely to be seniors (ages 65 and older).
Figure 4. Age Distribution of the U.S. Population, by Origin, 2023
Note: Percentages may not add up to 100 as they are rounded to the nearest whole number.
Source: MPI tabulation of data from the U.S. Census Bureau’s 2023 ACS.
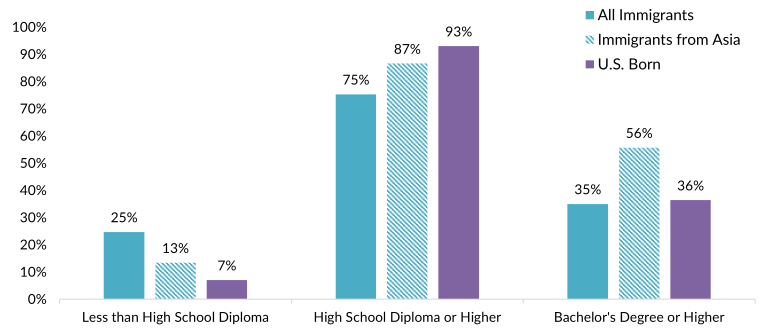
Immigrants from Asia tend to have much higher rates of educational attainment than either the U.S.- or overall foreign-born populations. In 2023, approximately 56 percent of Asia-origin immigrants ages 25 and older reported having a bachelor’s degree or higher, compared to 36 percent of U.S.-born and 35 percent of all immigrant adults (see Figure 5). More than two-thirds of immigrants from India (81 percent), Taiwan (76 percent), and Turkey (68 percent) were college graduates, compared to less than one-quarter of those from Cambodia (20 percent), Laos (15 percent), and Yemen (14 percent).
Figure 5. Educational Attainment of the U.S. Population (ages 25 and older), by Origin, 2023
Note: Percentages may not add up to 100 as they are rounded to the nearest whole number.
Source: MPI tabulation of data from the U.S. Census Bureau 2023 ACS.
Click here for data on immigrants’ educational attainment by country of origin, overall and of recent arrivals.
This high educational attainment partly reflects the prevalence of international students from Asia in the United States. About 861,000 international students from Asia were enrolled in U.S. higher education institutions in the 2023-24 school year, according to the Institute of International Education, comprising more than three-quarters of all 1.1 million international students in the United States. India, China, South Korea, Taiwan, and Vietnam were the top origin countries, together accounting for 82 percent of students from Asia and 62 percent of all international students in the United States (see Table 3). Over the past decade, the number of students from Asia in the United States has increased by 29 percent, slightly outpacing the increase in the total number of international students (27 percent). The largest increases have come from students from Kyrgyzstan (300 percent increase), Bangladesh (256 percent increase), India (223 percent increase), and Myanmar (209 percent increase).
Table 3. International Students in the United States from Asia, by Origin, 2023-24 School Year
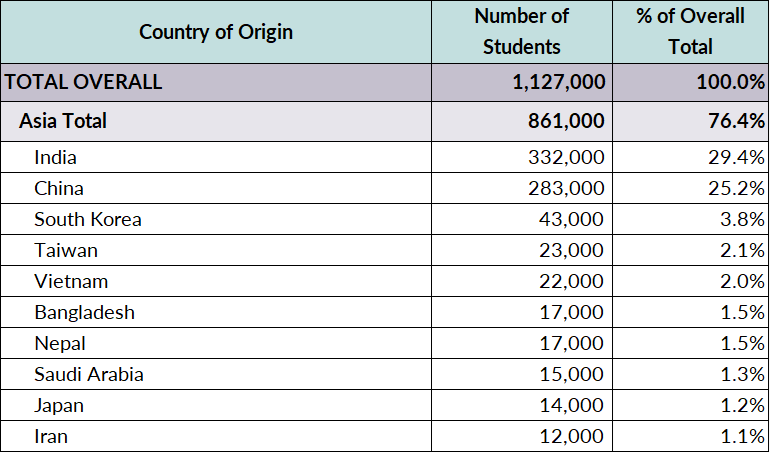
Source: MPI tabulation of data from the Institute of International Education (IIE), "International Student Totals by Place of Origin, 2023/24," Open Doors: Report on International Educational Exchange (New York: IIE, 2024), available online.
Both Asia-origin and all immigrants participate in the labor force at slightly higher rates than the native-born population. About 66 percent of immigrants from Asia ages 16 and older were in the civilian labor force in 2023, compared to 67 percent of the overall foreign-born population and 63 percent of the U.S. born. In 2023, 57 percent of Asia-origin immigrants were employed in management, business, science, and arts occupations, significantly higher than the overall foreign-born (38 percent) and the native-born populations (44 percent; see Figure 6).
Figure 6. Employed Workers in the Civilian Labor Force (ages 16 and older), by Occupation and Origin, 2023
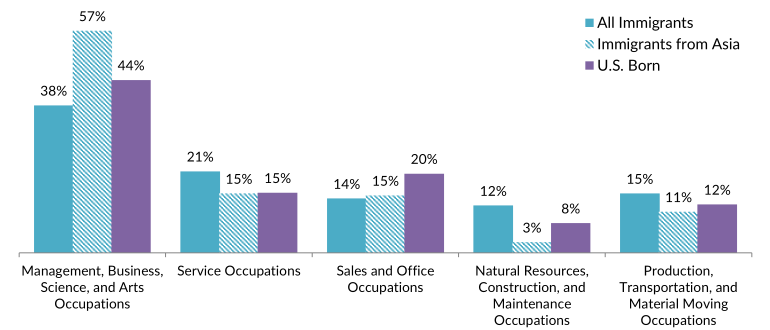
Note: Percentages may not add up to 100 as they are rounded to the nearest whole number.
Source: MPI tabulation of data from the U.S. Census Bureau 2023 ACS.
Immigrants from most Asian countries were primarily employed in management-related occupations, with those from India and Taiwan having the highest shares in these occupations (78 percent and 73 percent, respectively). The largest shares of immigrant workers from Laos (39 percent) and Myanmar (36 percent) were employed in production occupations, while Vietnamese and Thai workers were more likely to be employed in service occupations (31 percent and 28 percent, respectively).
Many immigrants from Asian countries, especially India, are employed in high-skilled jobs and enter the United States on temporary H-1B visas for specialty occupation workers. Of the 386,000 H-1B petitions approved in FY 2023, 72 percent of beneficiaries were born in India, followed by mainland China (12 percent). Five other Asian countries—the Philippines, South Korea, Pakistan, Taiwan, and Nepal—were among the top ten countries of origin for H-1B approved petitions.
On average, immigrants from Asia have significantly higher incomes than the overall foreign- and native-born populations. Households headed by immigrants from Asia had a median annual income of $105,200 in 2023, compared to $78,700 for all foreign-born-headed households and $77,600 for those headed by the native born. Households headed by immigrants from India ($166,200) and Taiwan ($124,600) had the highest median incomes among all groups from Asia, while Iraqi ($59,700) and Yemeni ($40,400) households had the lowest median incomes.
Immigrants from Asia were also less likely to be in poverty (11 percent) than the overall foreign-born population (14 percent) and slightly less likely than the native born (12 percent). Immigrants from Afghanistan (39 percent), Yemen (36 percent), and Syria (27 percent) were the most likely to be in poverty. (The U.S. Census Bureau defines poverty as having an income below $30,900 for a family of four in 2023).
Immigration Pathways and Naturalization
Immigrants from Asia are more likely to be naturalized U.S. citizens than the overall foreign-born population. In 2023, 63 percent of Asia-origin immigrants were U.S. citizens, compared to 52 percent of all immigrants. At least four-fifths of immigrants from Laos (83 percent), Iraq (82 percent), Lebanon (81 percent) and Cambodia and Vietnam (80 percent each) were naturalized, while those from Japan (35 percent) and Afghanistan (39 percent) were the least likely to be naturalized.
Immigrants from Asia are also slightly more likely to have arrived recently. In 2023, 38 percent of Asia-origin immigrants entered the United States in 2010 or later, compared to 35 percent of all immigrants (see Figure 7). Seventy-seven percent of immigrants from Afghanistan entered in 2010 or later, as did most of those from Nepal (67 percent), Turkey (55 percent), Myanmar (52 percent), and Yemen (51 percent), compared to less than one-fifth of immigrants from Laos (7 percent) and Cambodia (18 percent).
Figure 7. Immigrants from Asia and All Immigrants in the United States, by Period of Arrival, 2023
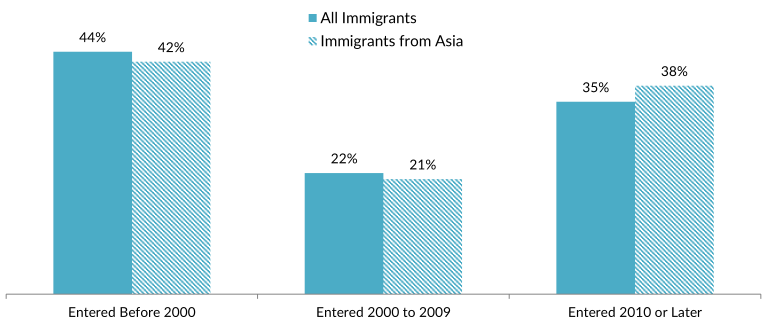
Note: Percentages may not add up to 100 as they are rounded to the nearest whole number.
Source: MPI tabulation of data from the U.S. Census Bureau 2023 ACS.
In FY 2023, Asia was the second largest region of origin for new lawful permanent residents (LPRs, also known as green-card holders), after North America. Approximately 420,000 (36 percent) of the nearly 1.2 million new LPRs were from Asia. Of the 419,000 immigrants from Asia who received a green card, 27 percent did so via employment, compared to 17 percent of all LPRs.
Unauthorized Immigrant Population
Approximately 851,000 immigrants from Asia were living in the United States without authorization as of mid-2023, according to MPI estimates, accounting for 6 percent of all 13.7 million unauthorized immigrants. The Philippines and India represented the seventh and tenth largest origin countries for unauthorized immigrants.
Click here for an MPI overview of the unauthorized immigrant population in the United States as of mid-2023.
As of September 2024, approximately 13,300 immigrants from Asia were active recipients of the Deferred Action for Childhood Arrivals (DACA) program, accounting for 2 percent of all 537,700 active DACA recipients. The top Asian countries of origin for DACA beneficiaries were South Korea (4,700), the Philippines (2,500), and India (1,600). DACA provides temporary deportation relief and work authorization to unauthorized immigrants who arrived as children and meet education and other eligibility criteria.
Click here to view the top origin countries of DACA recipients and their U.S. states of residence.
Immigrants from Asia are more likely to have health insurance than the overall foreign-born population. Only 6 percent of Asia-origin immigrants did not have insurance in 2023, the same share as the native-born population, compared to 18 percent of all immigrants. Immigrants from Asia are also more likely to have private health insurance (70 percent) than the overall foreign-born population (57 percent), and less likely to have public coverage (33 percent) than the U.S. born (38 percent; see Figure 8).
Figure 8. Health Coverage for Immigrants from Asia, All Immigrants, and the U.S. Born, 2023
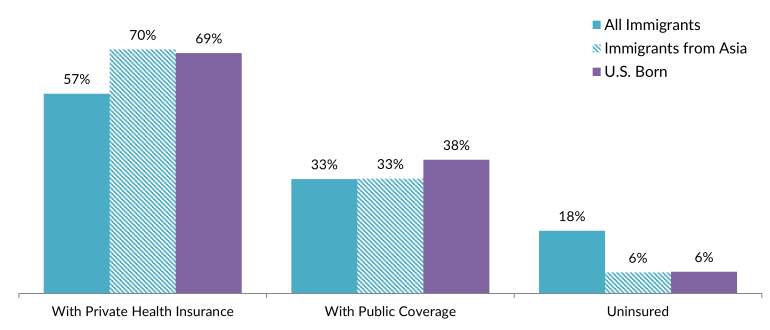
Note: The sum of shares by type of insurance is likely to be greater than 100 because people may have more than one type of insurance.
Source: MPI tabulation of data from the U.S. Census Bureau’s 2023 ACS.
The Chinese diaspora is the largest Asia-origin diaspora in the United States and the ninth largest diaspora group overall, according to MPI tabulation of data from the U.S. Census Bureau’s 2023 American Community Survey. Approximately 5.6 million individuals were either born in China or reported Chinese ancestry or race (see Table 4). The Indian and Filipino diasporas accounted for the tenth and 11th largest U.S. diasporas.
Table 4. Largest Asian-Origin Diaspora Groups in the United States, 2023

Notes: The term diaspora includes individuals born in the country as well as those who cited that origin as their ancestry, race, and/or ethnicity regardless of where they were born. Ancestry refers to a person’s ethnic origin or descent, “roots,” or heritage; or the place of birth of the person, the person's parents, or ancestors before their arrival in the United States. Diaspora figures may overlap for some groups. The foreign-born estimate for China includes people born in Hong Kong and Macau but not Taiwan. Diaspora estimate excludes persons reporting "Taiwanese alone" ancestry.
Source: MPI tabulation of data from the U.S. Census Bureau 2023 ACS.
Click here to see estimates of the 35 largest diaspora groups in the United States in 2023.
Of the 120.8 million migrants from Asia worldwide in 2024, 62 percent resided in other Asian countries, according to estimates by the United Nations Population Division. About 17 percent resided in Europe and 16 percent in Northern America.
Global remittances sent by migrants and other individuals to Asian countries via formal channels equaled more than U.S. $409 billion in 2023, according to the World Bank’s estimates. Remittances have grown rapidly from the mid-2000s. For most Asian countries, remittances represent a very small share of their gross domestic product (GDP): less than 0.1 percent in 2023 in Japan, Kuwait, Maldives, Oman, and Saudi Arabia. In contrast, economies in Tajikistan (38 percent), Lebanon (37 percent), Nepal (27 percent), and Kyrgyzstan (20 percent) were much more dependent on remittances.
Figure 9. Annual Remittance Flows to Asian Countries, 2000-23
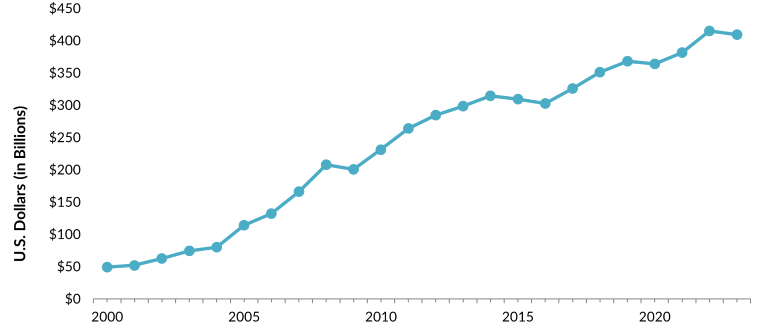
Source: MPI tabulation of data from the World Bank Global Knowledge Partnership on Migration and Development (KNOMAD), “Remittance Inflows,” June 2024 update, available online.
Click here to view an interactive chart showing annual remittances received and sent by countries in Asia and elsewhere.
Sources
Gibson, Campbell J. and Kay Jung. 2006. Historical Census Statistics on the Foreign-Born Population of the United States: 1850-2000. Working Paper no. 81, U.S. Census Bureau, Washington, DC, February 2006. Available online.
Institute of International Education (IIE). 2024. International Students: All Places of Origin. Available online.
Jingnan, Huo. 2024. What Drove Last Year’s Surge in Chinese Migrants at the Southern Border? National Public Radio (NPR), August 9, 2024. Available online.
Knowledge Partnership on Migration and Development (KNOMAD)/World Bank Group. 2024. Annual Remittances Data. June 2024 update. Available online.
Marrow, Brandon and Jeanne Batalova. 2024. Naturalized Citizens in the United States. Migration Information Source, July 10, 2024. Available online.
Migration Policy Institute (MPI), Migration Data Hub. N.d. U.S. Immigrant Population by State and County. Accessed January 8, 2025. Available online.
Moslimani, Mohammad and Jeffrey S. Passel. 2024. What the Data Says about Immigrants in the U.S. Pew Research Center short read, September 27, 2024. Available online.
Pew Research Center. 2012. The Rise of Asian Americans. Washington, DC: Pew Research Center. Available online.
Tian, Ziyao, Carolyne Im, Sahana Mukherjee, and Abby Budiman. 2024. Why Asian Immigrants Come to the U.S. and How They View Life Here. Washington, DC: Pew Research Center. Available online.
United Nations Population Division. 2020. International Migrant Stock 2020: Destination and Origin. Available online.
U.S. Census Bureau. 2024. 2023 American Community Survey. Access from Steven Ruggles, Sarah Flood, Matthew Sobek, Daniel Backman, Annie Chen, Grace Cooper, Stephanie Richards, Renae Rodgers, and Megan Schouweiler. IPUMS USA: Version 15.0 [dataset]. Minneapolis, MN: IPUMS, 2024. Available online.
---. N.d. 2023 American Community Survey—Advanced Search: S0201 Selected Population Profile in the United States. Accessed September 30, 2024. Available online.
U.S. Citizenship and Immigration Services (USCIS). 2024. Characteristics of H-1B Specialty Occupation Workers: Fiscal Year 2023 Annual Report to Congress. Washington, DC: DHS. Available online.
---. 2024. Count of Active DACA Recipients by Month of Current DACA Expiration as of September 30, 2024. Available online.
---. 2024. Naturalization Statistics. Updated December 16, 2024. Available online.
U.S. Customs and Border Protection (CBP). 2025. CBP Releases December 2024 Monthly Update. Press release, January 14, 2025. Available online.
---. 2025. Nationwide Encounters. Updated January 20, 2025. Available online.
U.S. Department of Homeland Security (DHS), Office of Homeland Security Statistics (OHSS). 2024. 2023 Yearbook of Immigration Statistics. Washington, DC: DHS OHSS. Available online.
Van Hook, Jennifer, Ariel G. Ruiz Soto, and Julia Gelatt. 2025. The Unauthorized Immigrant Population Expands amid Record U.S.-Mexico Border Arrivals. MPI short read, February 2025. Available online.