International Students in the United States

Nearly 1 million international students were enrolled in colleges and universities across the United States in school year 2014-15. (Photo: Southern Arkansas University)
In SY 2014-15, 975,000 international students were in the United States, with growth concentrated in a handful of states and STEM-heavy fields.
Since the mid-20th century, the United States has been the destination of choice for international students. When pursuing education abroad, many are drawn by the quality of its higher education system, its welcoming culture, and the prospect of transitioning into the labor market after graduation. Although the U.S. share of the worldwide international student population has decreased in recent years, from 23 percent in 2000 to 19 percent in 2013, the number of international students enrolled in U.S. colleges and universities has grown. In 2013, the United States hosted more of the world’s 4.1 million international students than any other country. The next two destinations, the United Kingdom and Australia, hosted 10 percent and 6 percent, respectively. International student enrollment in U.S. colleges and universities increased 10 percent between school year (SY) 2013-14 and SY 2014-15, the highest growth rate in 35 years, reaching a record high of 975,000 students.
Using data from the Institute for International Education (IIE), U.S. Immigration and Custom Enforcement (ICE), and NAFSA: Association of International Educators, this Spotlight provides information on the international students enrolled in U.S. colleges and universities in SY 2014-15. After outlining the legal framework for different forms of study in the section Student Visa Categories, this article will focus on the size and distribution of this group, enrollment trends, and impact on the U.S. economy and labor market.
Click on the bullet points below for more information:
- Visa Categories
- Enrollment Numbers and Trends
- Geographic Distribution and Leading Institutions
- Country of Origin
- Academic Level
- Field of Study
- Economic Impact
- Transition into the U.S. Labor Market
Foreign students seeking to study in the United States for any length of time must gain admission to an educational institution certified by the U.S. Immigration and Customs Enforcement’s Student and Exchange Visitor Program (SEVP) and be approved for a nonimmigrant visa. U.S. immigration law stipulates the following visa categories for international students and exchange visitors:
- F-1 visas for full-time students at academic institutions (colleges, universities, or high schools) or in language training programs;
- M-1 visas for full-time students at vocational or other nonacademic institutions;
- F-3 and M-3 visas for nationals of Canada and Mexico who commute to the United States for full- or part-time study at academic institutions (F-3) or vocational or other nonacademic institutions (M-3); and
- J-1 visas for exchange program participants. (Note: university or college students engaged in certain scholarship or exchange programs comprise only 1 of 14 J-1 categories; the others include physicians participating in graduate-level training, summer work-travel students, visiting professors and research scholars, and au pairs.)
International students in the United States on an F-1 visa are eligible for up to 12 months of practical training, a period during which they are authorized to work in a position related to their field of study. This can be completed part-time during their studies (beginning nine months or more after enrollment), called Concurrent Practical Training (CPT), or full-time upon graduation as Optional Practical Training (OPT). If a student pursues another post-secondary degree at a higher level (for example, beginning a graduate program after completing an undergraduate degree), they will become eligible for another 12 months of practical training. F-1 students with qualifying Science, Technology, Engineering and Mathematics (STEM) degrees may apply for a 24-month extension of their initial 12-month training period.
While most international students and exchange visitors return home, students on F-1 visas are permitted to adjust their status to another visa category, such as temporary foreign worker (including H-1B) or legal permanent resident. M-1 and J-1 students may also adjust their status, but frequently must meet stricter requirements.
In order to better collect and manage information about international students and exchange visitors admitted to the United States, the Department of Homeland Security (DHS) launched the Student and Exchange Visitor Program (SEVP) in August 2003 to centralize these data in an electronic repository. The records system, called the Student and Exchange Visitor Information System (SEVIS), tracks students exchange visitors, and their dependents, throughout the approved period of study. SEVP requires all institutions that qualify as visa sponsors to enter and regularly update student information in SEVIS.
As of March 31, 2016, SEVIS listed 9,000 certified educational institutions at which 1.18 million F-1 and M-1 students were registered and enrolled in classes. Similarly, 1,000 approved exchange visitor programs reported the participation of 201,000 J-1 exchange visitors. To put this in perspective, although the number of SEVP-certified institutions and exchange programs remained roughly the same between 2006 and 2016, the number of F-1 and M-1 students nearly doubled (from 612,000 in 2006) and the number of J-1 program participants increased 30 percent (from 154,000 in 2006).
The number of international students enrolled in U.S. colleges and universities has grown significantly over time (see Figure 1). This population grew from 26,000 in SY 1949-50, roughly doubling each decade to reach 286,000 in SY 1979-80, then increasing by 33 percent each decade between SY 1979-80 and SY 2009-10 to reach 691,000. Between SY 2009-10 and SY 2014-15, the number of students further grew by 41 percent to a record high of 975,000. Similarly, international students’ share of total enrollment in U.S. colleges and universities increased from 1 percent in SY 1949-50 to 5 percent in SY 2014-15.
Figure 1. Number of International Students in U.S. Colleges and Universities and their Share (%) of Total U.S. Enrollment, School Year (SY) 1949-50 to SY 2014-15
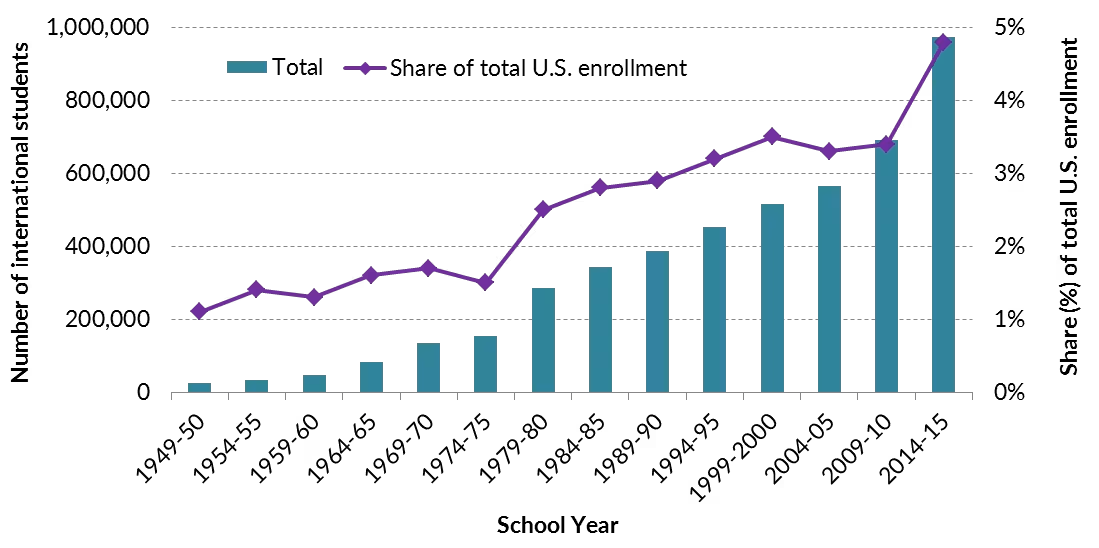
Source: Institute of International Education (IIE), “International Student Enrollment Trends, 1948/49-2014/15,” Open Doors Report on International Educational Exchange (Washington, DC: IIE, 2015), available online.
Geographic Distribution and Leading Institutions
In SY 2014-15, one in three international students studied in California, New York, or Texas (see Table 1). Together with Massachusetts, Illinois, Pennsylvania, and Florida, these top seven states hosted more than half of all international students in the United States. The international student population is more evenly spread out across the country than the overall U.S. foreign-born population, 25 percent of whom resided in California in 2014.
Table 1. Ten States with the Largest International Student Populations, SY 2014-15
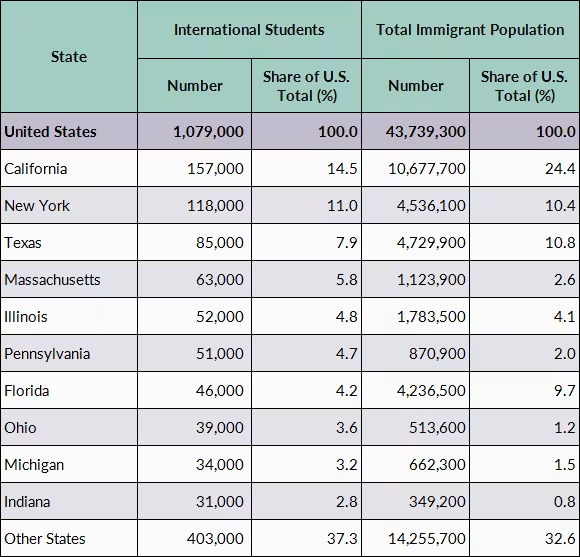
Source: Institute of International Education (IIE), “2015 Fast Facts,” Open Doors Report on International Educational Exchange (Washington, DC: IIE, 2015), available online.
International students represented 5 percent of all students enrolled in higher education across the country, but have an enrollment share higher than the national average in Washington, DC (12 percent), Massachusetts (11 percent), New York (8 percent), Washington (7 percent), and Rhode Island (7 percent).
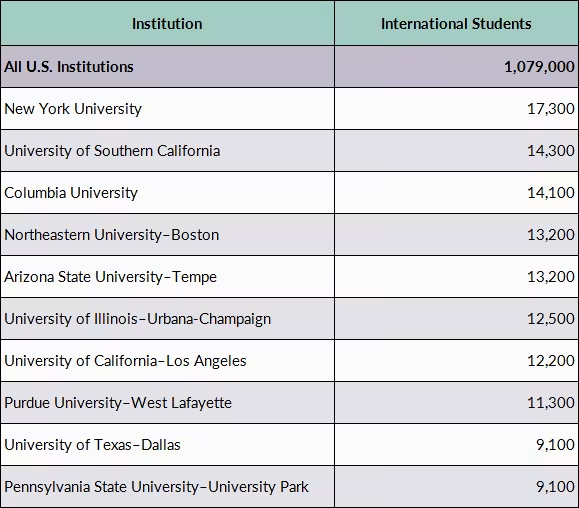
In SY 2014-15, New York University was the leading host university for the second year in a row. It was one of eight institutions to enroll more than 10,000 international students: New York University (13,000); University of South California (12,000); Columbia University (12,000); Arizona State University (11,000); University of Illinois, Urbana-Champaign (11,000), Northeastern University (11,000); Purdue University, West Lafayette (10,000); and University of California, Los Angeles (10,000).
- Click here for a 2014 Brookings Institution report offering a breakdown by U.S. metropolitan area of the origins of international students.
The country-of-origin composition of the U.S. international student population has changed markedly over time (see Table 2). In SY 1949-50, Canada, Taiwan, India, and a number of European and Latin American countries were the major sending countries. Three decades later in SY 1979-80, Asian countries featured more prominently among the top ten origin countries following the passage of the Immigration and Naturalization Act of 1965 that removed the national origin quota.
In SY 2014-15, China was the top origin country for international students in the United States, representing 31 percent, followed by India (14 percent), South Korea (7 percent), Saudi Arabia (6 percent), and Canada (3 percent). In the same year, 89,000 more students enrolled in U.S. colleges and universities compared to the previous year, growth that can largely be attributed to an increase in the number of students from India, China, and Brazil. While China remained the top origin country, increasing 11 percent between SY 2013-14 and SY 2014-15 to 304,000, growth in the number of students from India outpaced those from China, increasing 29 percent to 133,000. The number of students from Brazil, Kuwait, and Saudi Arabia, also increased significantly as a result of substantial investment by origin country governments in international scholarships for their nationals.
Table 2. Top 10 International Student Countries of Origin, SY 1949-50, SY 1979-80, and SY 2014-15
Source: Data for SY 1949-50 and 1979-80 are from Institute of International Education (IIE), "All Places of Origin of International Students, Selected Years: 1949/50-1999/00," Open Doors Report on International Educational Exchange (Washington, DC: IIE, 2009). Data for SY 2014-15 are from Institute of International Education (IIE), “International Student Totals by Place of Origin, 2013/14- 2014/15,” Open Doors Report on International Educational Exchange (Washington, DC: IIE, 2015), available online.
While international students engage in a variety of fields, there are three clear favorites: business management, engineering, and math and computer science accounted for more than half of all international enrollments at U.S. higher education institutions in SY 2014-15. Notably, close to half (44 percent) of international students were in a STEM field, the majority of whom are eligible for the extended 36-month OPT. Between SY 2013-14 and SY 2014-15, five fields of study—math and computer science (24 percent), engineering (16 percent), agriculture (15 percent), intensive English (13 percent), and fine and applied arts (11 percent)—experienced double-digit growth rates, while the share of students in education (1 percent) and the humanities (2 percent) decreased.
Figure 2. International Students’ Fields of Study, SY 2014-15
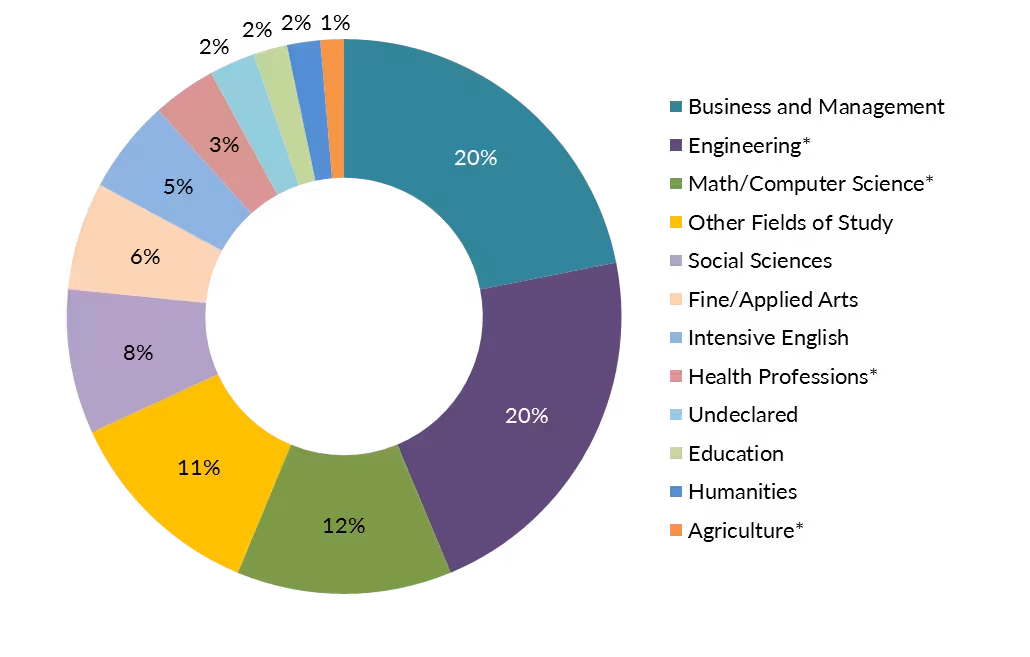
Note: *Science, Technology, Engineering, and Math (STEM) field.
Source: Institute of International Education, "International Students by Field of Study, 2013/2014 - 2014/15," Open Doors Report on International Educational Exchange (Washington, DC: IIE, 2015), available online.
Students from different countries tend to pursue different majors. For instance, the overwhelming majority of students from India (80 percent), Iran (79 percent), and Nepal (69 percent) were enrolled in STEM programs in SY 2014-15. By comparison, only 14 percent of Japanese students were enrolled in STEM fields, instead favoring business and management (19 percent) and intensive English (15 percent). More than a quarter of students from Vietnam (33 percent), Indonesia (29 percent), China (27 percent), and Germany, France, and Venezuela (26 percent each) were in business and management programs, while roughly one out of ten students from Taiwan (13 percent), South Korea (12 percent), and Hong Kong (10 percent) studied fine or applied arts.
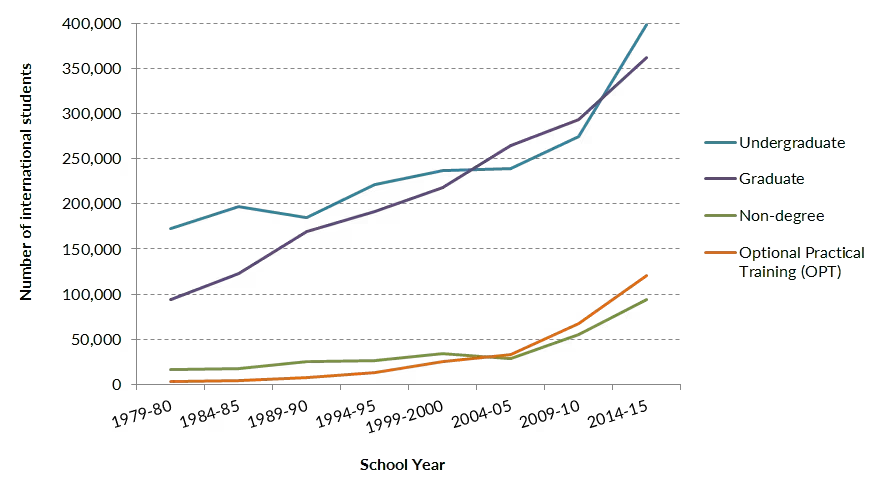
International student enrollment in all academic levels and participation in OPT are on the rise (see Figure 3). As of SY 2014-15, undergraduate international students outnumbered graduate students, and students enrolled in a degree program greatly outweighed non-degree students and those engaged in OPT.
Figure 3. Academic Level of International Students, SY 1979-80 to SY 2014-15
Source: Institute of International Education, "International Students by Academic Level, 2013/14 - 2014/15," Open Doors Report on International Educational Exchange (Washington, DC: IIE, 2015), available online.
International students contributed more than $30.5 billion to the U.S. economy in SY 2014-15. In that year, 72 percent of all international students received the majority of their funds from sources outside the United States: 64 percent from personal and family resources and another 8 percent from foreign governments or universities.
For an additional breakdown of international students’ economic impact at state and congressional district levels, see this NAFSA data tool.
Transition into the U.S. Labor Market
While the benefits of hosting international students for colleges and universities are well understood, research tracking their transition into the U.S. labor market and measuring their economic value for the United States is relatively limited due to the lack of longitudinal data.
The research that does exist suggests a low transition rate into the U.S. labor market among international students in recent years, pointing to the limited availability of work visas as the main barrier. Economist Giovanni Peri, in a 2016 regional study, highlights the extremely low retention rates of F-1 visa holders in local economies, and recommends both expanding work visa options for STEM graduates and giving state governments more flexibility to create incentives for graduates to stay.
Sources
Institute of International Education (IIE). 2015. What International Students Think about U.S. Higher Education: Attitudes and Perceptions of Prospective Students from around the World. Washington, DC: IIE. Available Online.
———. 2015. Open Doors Report on International Educational Exchange. Washington, DC: IIE. Available Online.
Organisation for Economic Co-Operation and Development (OECD). 2015. Education at a Glance 2015: OECD Indicators. Paris: OECD Publishing. Available Online.
U.S. Immigration and Customs Enforcement (ICE). 2016. Student and Exchange Visitor Program by the Numbers. Washington, DC: ICE. Available Online.
Ruiz, Neil G. 2014. The Geography of Foreign Students in U.S. Higher Education: Origins and Destinations. Washington, DC: The Brookings Institution. Available Online.
Peri, Giovanni, Gaetano Basso, and Sara McElmurry. 2016. Opportunity Lost: The Economic Benefit of Retaining Foreign-Born Students in Local Economies. Chicago: The Chicago Council on Global Affairs. Available Online.


Related Content