Immigrant Veterans in the United States

An immigrant from Rwanda serving in the U.S. Air Force. (Photo: Samuel King Jr./U.S. Air Force)
Highlights
Nearly 731,000 immigrants were U.S. veterans as of 2022; this population is growing, highly educated, and more diverse than its native-born counterparts.
- Approximately 4.5 percent of all U.S. military veterans were foreign born as of 2022, more than double their share in 1990.
- Mexican and Filipino immigrants comprised the largest groups of foreign-born veterans, at 15 percent and 11 percent, respectively.
- Immigrant veterans outperform native-born veterans on several economic measures: median household income is higher, they have higher college graduation rates, and higher labor force participation.
Immigrants have served in the U.S. military since the nation’s founding. Their share of overall military enlistment has fluctuated over time in response to recruitment needs and other factors, yet the foreign born have been a constant presence in the U.S. armed forces. As of 2022, nearly 731,000 U.S. veterans had been born outside the United States, representing 4.5 percent of the country’s 16.2 million veterans.
Naturalized citizens, lawful permanent residents (LPRs, also known as green-card holders), and certain nationals of three Pacific Island countries in free association with the United States—the Federated States of Micronesia, the Marshall Islands, and Palau—are eligible for U.S. military service. Other foreign-born individuals may be eligible to serve if the secretary of a specific military branch determines they have a skill or expertise “that is vital to the national interest,” as was the case with the Military Accessions Vital to the National Interest (MAVNI) program which ran from 2008 to 2016.
Using data from the U.S. Census Bureau’s 2022 American Community Survey (ACS), this Spotlight provides information on immigrant veterans (ages 18 and older) in the United States, focusing on the population’s size, racial and ethnic composition, socioeconomic characteristics, and top countries of origin. It is important to note that Census Bureau data come from household-based surveys and are thus likely to undercount people experiencing homelessness, of whom a disproportionate share are veterans, regardless of nativity.
Definitions
The U.S. Census Bureau defines the “foreign born” as individuals who had no U.S. citizenship at birth. The foreign-born population includes naturalized citizens, lawful permanent residents, refugees and asylees, legal nonimmigrants (including those on student, work, or other temporary visas), and people residing in the country without authorization. The terms “foreign born” and “immigrant” are used interchangeably and refer to those who were born in another country and later emigrated to the United States.
The terms “U.S. born” and “native born” are used interchangeably and refer to people residing in the United States who were U.S. citizens in one of three categories: people born in one of the 50 states or the District of Columbia; people born in U.S. Insular Areas such as Puerto Rico or Guam; or people born abroad to at least one U.S. citizen parent.
The term “veterans” refers to civilian persons ages 18 and older who served in U.S. Army, Navy, Air Force, Marine Corps, or Coast Guard in a time of war or peace, or who served in the U.S. Merchant Marines during World War II, but who were not in the armed forces at the time the census survey was administered.
Click on the bullet points below for more information:
- Size of the Foreign-Born Veteran Population over Time
- Country of Birth
- Citizenship
- Race and Ethnicity
- English Proficiency and Language Diversity
- Gender and Marital Status
- Age, Education, and Employment
- Income and Poverty
- Health Insurance Coverage
Size of the Foreign-Born Veteran Population over Time
Over the past three decades, the total number of veterans has declined by nearly half, from 30.6 million in 1990 to 16.2 million in 2022. The decrease is in part attributable to the drop in enlistments that began in the early 1990s and in part to the deaths of veterans who served during and shortly after World War II.
The size of the foreign-born veteran population has fluctuated slightly. In 1990, there were 760,000 immigrant veterans, a number that increased to 825,000 in 2000 and then declined to 731,000 in 2022. However, immigrants comprise a much larger share of the overall veteran population than in the past. In 1990, about 2 percent of U.S. veterans were foreign born; today that figure is 4.5 percent, with significant gains happening since 2010 (see Figure 1). This trend reflects in part the rising share of immigrants among the broader U.S. population, as well as efforts to boost enlistment by opening pathways to eligible noncitizens and holders of certain temporary visas with certain skills (see Box 1).
Box 1. Military Accessions Vital to the National Interest Program
Beginning in 2008, the Military Accessions Vital to the National Interest (MAVNI) program allowed eligible noncitizens (including refugees, asylees, and certain nonimmigrant visa holders maintaining their legal status for two years or more) with in-demand skills, particularly in health care and critical languages, to join the military in exchange for expedited U.S. citizenship. Approximately 10,400 noncitizens were recruited through this program. However, in 2016, the Obama administration ordered enhanced background screening of MAVNI recruits because of national-security concerns, delaying enlistments under the program. Additional background checks were introduced during the Trump administration and authorization expired in 2017.
Figure 1. Total Number of Veterans of the U.S. Armed Forces and the Immigrant Share (%), 1990-2022

Source: Migration Policy Institute (MPI) tabulation of data from the U.S. Census Bureau 2010 and 2022 American Community Survey (ACS) and 1990 and 2000 decennial census.
Country of Birth
Reflecting a long history of service in the U.S. military, Mexican and Filipino immigrants comprised the largest groups of foreign-born veterans in 2022, representing 15 percent and 11 percent (or 111,000 and 84,000 individuals), respectively. Other top origin countries included Germany, Canada, and Cuba (see Figure 2).
Figure 2. Countries of Birth of Foreign-Born Veterans of the U.S. Armed Forces, 2022
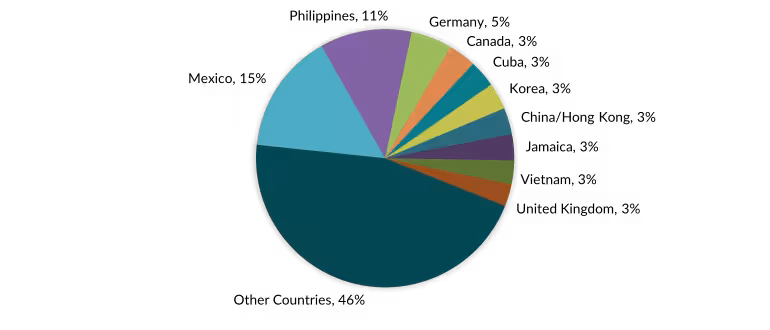
Source: MPI tabulation of data from the U.S. Census Bureau 2022 ACS.
Citizenship
The vast majority of immigrant veterans as of 2022 were naturalized citizens: 84 percent (or 613,000).
During times of peace, noncitizen members of the armed forces may obtain citizenship after one year of service. Section 329 of the Immigration and Nationality Act authorizes the president to issue executive orders specifying periods of conflict during which foreign-born members of the U.S. military are immediately eligible for U.S. citizenship. In a July 2002 executive order, President George W. Bush designated September 11, 2001 as the start of a period of such hostilities, and noncitizen military personnel serving on or after that date become eligible for citizenship immediately after enlistment. That order remains in effect as of this writing. Furthermore, revisions to U.S. citizenship law in 2004 have allowed U.S. Citizenship and Immigration Services (USCIS) to conduct naturalization interviews and ceremonies for U.S. armed forces members at military bases abroad.
More than 40,000 service members became citizens between fiscal years (FY) 2019 and 2023, including more than 12,000 people in FY 2023.
Click here for an interactive data tool showing the number of military and civilian naturalizations each year since FY 1910.
Race and Ethnicity
The racial and ethnic composition of foreign-born veterans is much more diverse than that of U.S.-born veterans. Close to two-thirds of immigrant veterans in 2022 identified as Hispanic or Asian/Pacific Islander (33 percent and 30 percent, respectively), and 24 percent identified as White (see Figure 3). In contrast, approximately 75 percent of U.S.-born veterans identified as White, followed by 13 percent as Black, 7 percent as Hispanic, and 2 percent as Asian/Pacific Islander.
Figure 3. Race and Ethnicity of U.S. Military Veterans, by Nativity, 2022
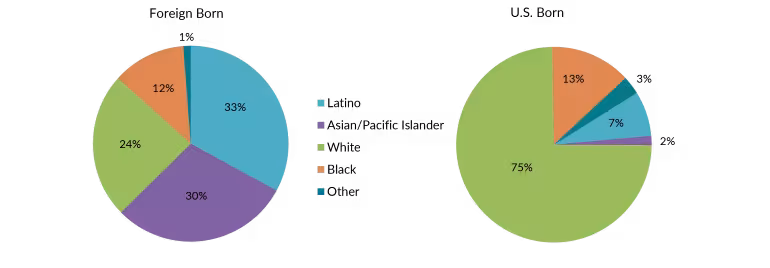
Notes: White, Black, Asian American/Pacific Islander, and Other (American Indian or multiracial individuals) refer to non-Latinos.
Source: MPI tabulation of data from the U.S. Census Bureau 2022 ACS.
English Proficiency and Language Diversity
Compared to the overall U.S. foreign-born population, immigrant veterans are much more likely to be proficient in English. As of 2022, 24 percent of immigrant veterans reported speaking English less than “very well,” versus 47 percent of all foreign-born civilian adults (ages 18 and older).
Additionally, 34 percent of immigrant veterans reported speaking only English at home. The remainder spoke a wide range of languages, including Spanish (29 percent), Tagalog (8 percent), Chinese (3 percent), and Vietnamese, Korean, or German (2 percent each).
Gender and Marital Status
Although the overall presence of women in the armed forces—and subsequently in the veteran population—has historically been low, a somewhat higher share of immigrant veterans are women than of the native born. In 2022, approximately 14 percent of foreign-born veterans were female, compared to 10 percent of native-born veterans.
Immigrant veterans were also more likely to be married and less likely to be divorced compared to native-born veterans, reflecting a similar pattern among nonveterans. As of 2022, 67 percent of immigrant veterans were married, versus 63 percent of native veterans. Approximately 13 percent of foreign-born veterans were divorced, compared to 16 percent of U.S.-born veterans.
Age, Education, and Employment
Among veterans, immigrants tend to be slightly younger than the native born. In 2022, the median age of foreign-born veterans was 59 years old, compared to 64 years old for those born in the United States. Fifty percent of U.S.-born veterans were 65 and older, versus 39 percent of their immigrant counterparts.
In general, immigrant veterans (ages 25 and older) have higher educational attainment than nonveteran immigrants. They are also more likely to be college graduates than U.S.-born veterans. As of 2022, about 12 percent of immigrant veterans lacked a high school diploma or equivalent, versus 25 percent of other immigrants. At the same time, approximately 36 percent of immigrant veterans had at least a bachelor’s degree, compared to 31 percent of native-born veterans. (see Figure 4).
Figure 4. Educational Attainment of Adults (ages 25 and older), by Veteran Status and Nativity, 2022
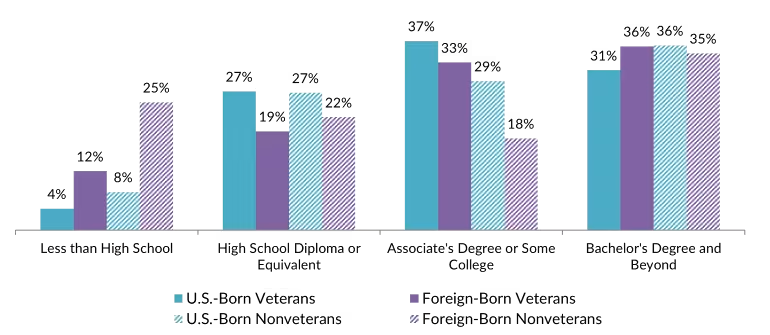
Source: MPI tabulation of data from the U.S. Census Bureau 2022 ACS.
Immigrant veterans participate in the civilian labor force at a higher rate than their U.S.-born counterparts. Fifty-five percent of immigrant veterans were in the civilian labor force in 2022, compared to 46 percent of U.S.-born veterans—though both rates were lower than for the foreign- and U.S.-born nonveteran adult populations (68 percent and 65 percent, respectively).
Among those in the civilian labor force, unemployment rates for veterans (about 3 percent) were slightly lower than those of nonveterans (about 4 percent), regardless of nativity.
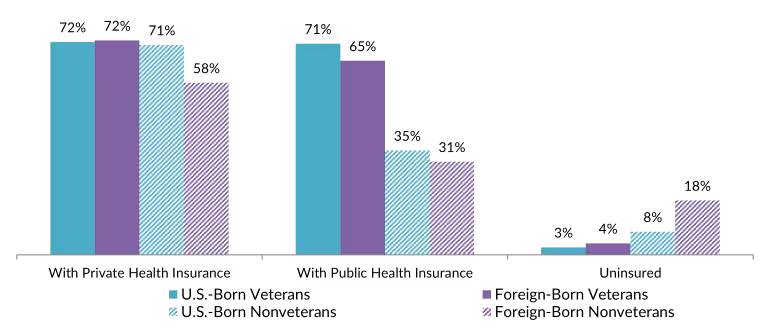
Overall, the occupational distribution of veterans employed in the civilian labor force largely resembles that of nonveterans. Consistent with their higher levels of educational attainment, immigrant veterans were more likely in 2022 to be in management, business, science, and arts occupations (45 percent) than nonveteran immigrants (38 percent) and less likely to be employed in service occupations (14 percent versus 21 percent; see Figure 5).
Click here for an interactive data tool showing immigrants as a share of the total population and the civilian labor force over time.
Figure 5. Occupation of Employed Workers (ages 18 and older), by Veteran Status and Nativity, 2022
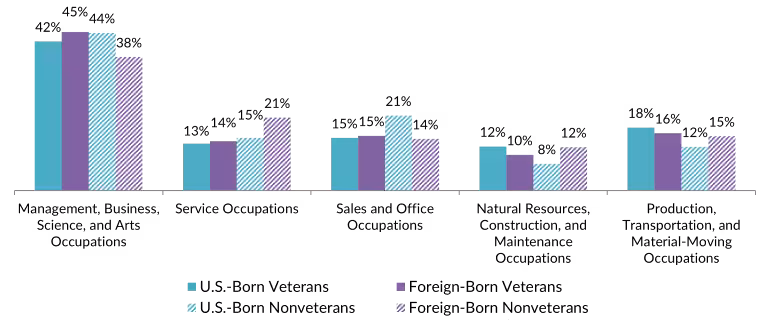
Source: MPI tabulation of data from the U.S. Census Bureau 2022 ACS.
Income and Poverty
Households headed by immigrant veterans tend to have higher incomes than those headed by native-born veterans. In 2022, immigrant veterans had a median household income of $87,000, compared to $74,000 for native-born veteran households. For comparison, the median household incomes for foreign- and native-born nonveterans were more similar, at $72,000 and $71,000, respectively.
Regardless of nativity, veterans are much less likely than nonveterans to be in poverty. In 2022, 7 percent of U.S.-born and 8 percent of foreign-born veterans lived in poverty, compared to 11 percent and 13 percent respectively for native- and foreign-born nonveterans. Because Census Bureau data are collected on households, they likely undercount homeless veterans (of all origins). The U.S. Department of Housing and Urban Development (HUD) estimates that almost 35,600 veterans were homeless on a single night in January 2023, a 7 percent increase from 2022 but a 36 percent drop from 2013.
Health Insurance Coverage
In 2022, the vast majority of veterans regardless of nativity were covered by at least one type of health insurance (see Figure 6). In addition to Medicaid and Medicare, which are available to eligible populations regardless of veteran status, public health insurance options for veterans include coverage through the U.S. Department of Veterans Affairs (VA). In 2022, 56 percent of both foreign- and native-born veterans with public coverage were covered by VA health-care programs.
Uninsured rates among veterans—3 percent for natives and 4 percent for immigrants—were extremely low compared to the nonveteran population.
Figure 6. Health Coverage for Adults (ages 18 and older), by Veteran Status and Nativity, 2022
Note: The sum of shares by type of insurance is likely to be greater than 100 because people may have more than one type of insurance.
Source: MPI tabulation of data from the U.S. Census Bureau 2022 ACS.
Sources
CFR.org Editors. 2020. Demographics of the U.S. Military. Council on Foreign Relations, July 13, 2020. Available online.
Chishti, Muzaffar, Austin Rose, and Stephen Yale-Loehr. 2019. Noncitizens in the U.S. Military: Navigating National Security Concerns and Recruitment Needs. Washington, DC: Migration Policy Institute (MPI). Available online.
Copp, Tara. 2018. Here’s the Bottom Line on the Future of MAVNI: Many Foreign-Born Recruits May Soon Be Out. Military Times, July 6, 2018. Available online.
De Sousa, Tanya et al. 2024. The 2023 Annual Homelessness Assessment Report (AHAR) to Congress. Washington, DC: U.S. Department of Housing and Urban Development (HUD). Available online.
U.S. Census Bureau. 2024. 2022 American Community Survey. Accessed from Steven Ruggles, Sarah Flood, Matthew Sobek, Daniel Backman, Annie Chen, Grace Cooper, Stephanie Richards, Renae Rodgers, and Megan Schouweiler. IPUMS USA: Version 15.0 [dataset]. Minneapolis, MN: IPUMS. Available online.
U.S. Citizenship and Immigration Services (USCIS). 2023. Military Naturalization Statistics. Updated November 8, 2023. Available online.
Vespa, Jonathan. 2023. Aging Veterans: America’s Veteran Population in Later Life. Suitland, MD: U.S. Census Bureau. Available online.


