Frequently Requested Statistics on Immigrants and Immigration in the United States

A U.S. passport and green card. (Photo: iStock.com/leekris)
Highlights
The United States is home to more immigrants than any other country worldwide and immigration accounted for all U.S. population growth between 2022 and 2023.
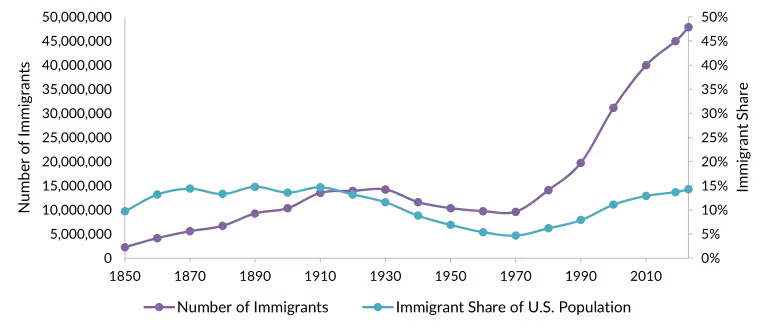
- The United States was home to 47.8 million immigrants in 2023, accounting for 14.3 percent of the total population and near the record 14.8 percent set in 1890.
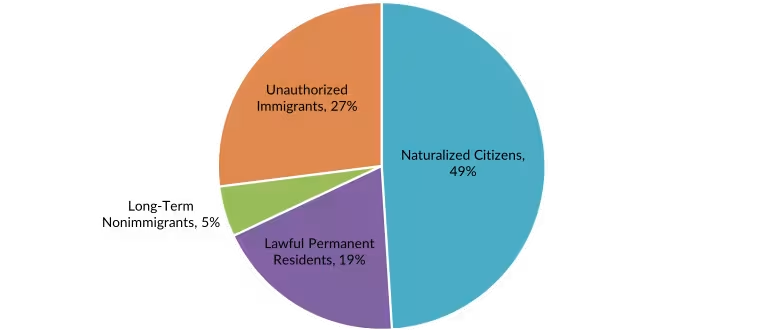
- About 73 percent of immigrants held long-term legal status, either as naturalized citizens, legal permanent residents, or holders of long-term temporary visas.
- In fiscal year (FY) 2024, more than 100,000 refugees were resettled—the most in 30 years—before President Donald Trump suspended the program indefinitely.
- Immigrants comprise close to 18 percent of the U.S. civilian labor force, and their median household income is slightly above that of U.S.-born households.
Worldwide, the United States is home to more immigrants than any other country, and more than the next four countries—Germany, Saudi Arabia, the United Kingdom, and France—combined, according to the most recent UN Population Division data. While the United States represented about 4 percent of the total global population in 2024, 17 percent of all international migrants resided in the United States.
The size, though not the share, of the U.S. immigrant population is at a record high. Immigration has been an important contributor to U.S. population growth, which has slowed in the past decade due to falling birth rates. Amid this demographic slowing, immigration accounted for the entire growth of the total U.S. population between 2022 and 2023—the first time this has happened since census data collection on nativity began in 1850.
Download a Print-Friendly Version
There were 47.8 million immigrants residing in the United States as of 2023, according to the latest American Community Survey (ACS) from the U.S. Census Bureau. Of them, nearly three-quarters were in the country legally as naturalized citizens, legal permanent residents (LPRs, also known as green-card holders), or holders of temporary visas.
Sources
This article draws on statistics from the U.S. Census Bureau (using its most recent 2023 American Community Survey [ACS], 2024 Current Population Survey [CPS], and 2000 decennial census); the U.S. Departments of Homeland Security (DHS) and State; and the Migration Policy Institute (MPI).
Note: DHS and State Department data refer to fiscal years that begin on October 1 and end on September 30; Census Bureau data refer to calendar years.
This Spotlight offers information about immigrants resident in the United States as well as temporary visitors. Drawing from the most authoritative and current data available, this article offers an overview of present and past U.S. immigration trends, sociodemographic information about who is immigrating, and the channels through which they arrive. It also provides data on the government’s enforcement actions and visa processing.
For more detailed information on U.S. and global immigration data sources and one-click access to these datasets, see the Migration Policy Institute (MPI) Immigration Data Matters guide. Data tools and maps in this article can be accessed through MPI’s Migration Data Hub.
Definitions
Foreign born" and "immigrant" are used interchangeably and refer to persons with no U.S. citizenship at birth. This population includes naturalized citizens, lawful permanent residents, refugees and asylees, people on certain temporary visas, and unauthorized immigrants.
Geographical regions: MPI follows the definition of Latin America as put forth by the United Nations and the U.S. Census Bureau, which spans Central America (including Mexico), the Caribbean, and South America. For more information about geographical regions, see the U.S. Census Bureau and United Nations Statistics Division.
Click on the bullet points for more information on each topic:
- Population Size and Evolving Origins
- Immigrants’ Characteristics and Families
- Top U.S. Destinations
- Permanent Immigration and Naturalization
- Refugees and Asylum Seekers
- Temporary Visas
- Unauthorized Immigration and Enforcement
Population Size and Evolving Origins
How many immigrants live in the United States?
More than 47.8 million immigrants lived in the United States in 2023, the most in U.S. history. That year, immigrants comprised 14.3 percent of the U.S. population of 331.9 million, close to the record level of 14.8 percent set in 1890. The immigrant population grew by more than 1.6 million people between 2022 and 2023, or about 3.6 percent, the largest annual growth since at least 2010.
How have the number and share of immigrants changed over time?
In 1850, the first year the United States began collecting nativity data through the Census, the country had 2.2 million immigrants, representing nearly 10 percent of the U.S. population.
Between 1860 and 1920, the immigrant share fluctuated between 13 percent and nearly 15 percent of the population, peaking at 14.8 percent in 1890 amid high levels of immigration from Europe. Restrictive immigration laws in 1921 and 1924 limited permanent immigration almost exclusively to arrivals from Northern and Western Europe. Combined with the Great Depression and onset of World War II, this led to a sharp drop in immigration from the Eastern Hemisphere. Immigration steadily declined through 1970, when 9.6 million immigrants comprised a record-low 4.7 percent of all U.S. residents (see Figure 1).
Figure 1. Size and Share of the Immigrant Population in the United States, 1850-2023
Sources: Migration Policy Institute (MPI) tabulation of data from U.S. Census Bureau 2010-23 American Community Surveys (ACS), and 1970, 1990, and 2000 decennial census; and Campbell J. Gibson and Emily Lennon, "Historical Census Statistics on the Foreign-Born Population of the United States: 1850 to 1990" (Working Paper no. 29, U.S. Census Bureau, Washington, DC, 1999).
Since 1970, the number of immigrants and their share of the U.S. population has increased rapidly, mainly because of increased immigration from Latin America and Asia. This followed important changes in U.S. immigration law such as enactment of the Immigration and Nationality Act of 1965, which abolished national-origin admission quotas, and the creation of a formal refugee resettlement program with the Refugee Act of 1980. Other factors included the growing U.S. economic and military presence in Asia and Latin America, as well as evolving economic and social ties with the United States’ southern neighbors and major economic transformations and political instability in countries around the world.
- Data tool: U.S. Immigrant Population and Share over Time, 1850-Present
- Article: Immigration Has Been a Defining, Often Contentious, Element Throughout U.S. History
- Article: A Century Later, Restrictive 1924 U.S. Immigration Law Has Reverberations in Immigration Debate
Where are immigrants from originally?
The 10.9 million U.S. residents born in Mexico represented by far the largest immigrant group in the United States in 2023, although this population declined by about 793,000 since 2010. Mexican immigrants made up 23 percent of the U.S. immigrant population in 2023, down from 29 percent in 2010.
India and China (including Hong Kong and Macao but not Taiwan) were the next largest origin countries, accounting for approximately 2.9 million and 2.4 million immigrants, respectively, or 6 percent and 5 percent of all immigrants. Other top countries of origin included the Philippines (4 percent); El Salvador, Cuba, Vietnam, the Dominican Republic, and Guatemala (about 3 percent apiece); and Colombia (2 percent).
Together, these ten countries accounted for 55 percent of all U.S. immigrants in 2023.
Learn more about various immigrant groups with the Migration Information Source’s U.S. Immigrant Population Spotlights. These data snapshots provide a wealth of information about groups including Mexicans, Indians, Chinese, and Filipinos, as well as more recent populations such as Afghans, Ukrainians, and Venezuelans.
How do today’s top countries of origin compare to those of the past?
Significant immigration from Latin America and Asia in recent decades represents a sharp turnaround from the mid-1900s, when immigrants came overwhelmingly from Europe. In the 1960s, no single country accounted for more than 15 percent of the U.S. immigrant population; Italians were the top origin group, making up 13 percent of the foreign born in 1960, followed by Germans and Canadians (about 10 percent each).
Immigrants from Mexico have comprised the largest group since 1980, but the composition of new arrivals has changed since the 2007-09 recession. By 2013, India and China had displaced Mexico as the top origins for new arrivals. However, amid COVID-19 pandemic-related mobility restrictions and high recent flows, Mexico regained its position as the origin of most new arrivals in 2021. As of 2023, the top origins for immigrants arriving within the last year were Mexico, India, and Cuba.
Between 2010 and 2023, the immigrant population from India increased by more than 1.1 million and the population from China rose by 628,000. In contrast, the number of Mexican immigrants declined by almost 793,000, representing the largest absolute decline of any immigrant group during the period.
The number of immigrants from Venezuela, Guatemala, Colombia, Honduras, the Dominican Republic, Brazil, Cuba, El Salvador, the Philippines, and Nigeria each increased by at least 250,000 from 2010 to 2023.
Among the groups numbering at least 100,000 in 2023, the Venezuelan immigrant population increased the fastest, by 318 percent since 2010, followed by immigrants from Afghanistan (301 percent), Nepal (159 percent), Nigeria and Bangladesh (117 percent each), and Brazil (108 percent). In comparison, the total foreign-born population grew by 20 percent in this period.
- Data tool: Regions of Birth for Immigrants in the United States, 1960-Present
- Data tool: Countries of Birth for U.S. Immigrants, 1960-Present
- Data tool: Largest U.S. Immigrant Groups over Time, 1960-Present
How long have current immigrants lived in the United States?
Nearly 44 percent of all immigrants in the United States in 2023 arrived prior to 2000. Additionally, 22 percent entered between 2000 and 2009, and 35 percent have come since 2010.
What are the largest diaspora groups?
Four of the five largest U.S. groups tracing their origin or ancestry to a particular country are European, reflecting a centuries-long history of immigration from Europe. Germany is the largest, with more than 41.1 million U.S. residents, native and foreign born alike, tracing their origin or ancestry there as of 2023. The Mexican-origin diaspora ranked second, with approximately 39.4 million people. The United Kingdom came third, with more than 37.5 million, followed by Ireland with 34.9 million and Italy with 16.2 million.
The overwhelming majority of these diaspora groups are people born in the United States.
- Data tool: Top Diaspora Groups in the United States
Do most immigrants have legal status?
About 73 percent of immigrants in the United States held permanent legal status (as a naturalized citizen, green-card holder, or refugee or asylee) or a long-term nonimmigrant visa (such as an international student or temporary worker) as of 2023 (see Figure 2).
Figure 2. Immigrant Population in the United States by Legal Status, 2023
Note: Figure shows a preliminary estimate.
Source: The Pennsylvania State University Social Science Research Institute, “New Estimates Reveal Size and Heterogeneity of Unauthorized Immigrant Population,” February 13, 2025, available online.
Immigrants’ Characteristics and Families
Definitions
College-educated persons are defined as adults 25 and older with a bachelor's degree or higher.
Race as used by the U.S. Census Bureau reflects the race or races with which individuals most closely self-identify. Race categories include both racial and national-origin groups.
Hispanic and Latino are ethnic, not racial, categories. They include individuals who classified themselves in one of the specific Spanish, Hispanic, or Latino categories listed on the decennial census and American Community Survey questionnaire—"Mexican, Mexican Am., Chicano," "Puerto Rican," or "Cuban"—as well as those who indicate that they are "other Spanish/Hispanic/Latino origin."
Read more about the U.S. Census Bureau’s definitions here.
How old are immigrants?
The median age of the immigrant population in 2023 was 47, making it older than the U.S.-born population, which had a median age of 37 years.
One reason for this difference is that immigrants arrive largely as adults, whereas their U.S.-born children contribute to the younger median age of the native-born population. Less than 1 percent of immigrants were under age 5 in 2023, compared to 6 percent of the U.S. born. Five percent of immigrants were children ages 5 to 17, compared to 18 percent of the U.S. born. Seventy-six percent of immigrants were of working age (18 to 64 years), a much higher figure than the 58 percent of the U.S. born. Approximately 18 percent of the foreign- and U.S.-born populations were age 65 or older.
What is the racial makeup of the immigrant population?
In 2023, about 27 percent of immigrants reported their race as single-race Asian, 20 percent as White, 9 percent as Black, 1 percent as American Indian and Alaska Native, less than 0.5 percent as Native Hawaiian and other Pacific Islander, and 20 percent as some other race. About 22 percent reported having two or more races.
- Data table: State Immigration Data Profiles
How many immigrants are Hispanic or Latino?
In 2023, nearly 45 percent of U.S. immigrants (21.5 million people) reported having Hispanic or Latino ethnic origins.
Note: The Census Bureau classifies Hispanic and Latino as ethnic categories, separate from the racial categories listed above (see Definitions box for more information).
How many Hispanics are immigrants?
Most U.S. Hispanics are U.S. born. Of the 65.1 million people in 2023 who self-identified as Hispanic or Latino, 67 percent (43.7 million) were native born and 33 percent (21.5 million) were immigrants.
Which languages are most frequently spoken at home?
Regardless of nativity, in 2023 approximately 78 percent (245.6 million) of all 316.6 million U.S. residents ages 5 and older reported speaking only English at home.
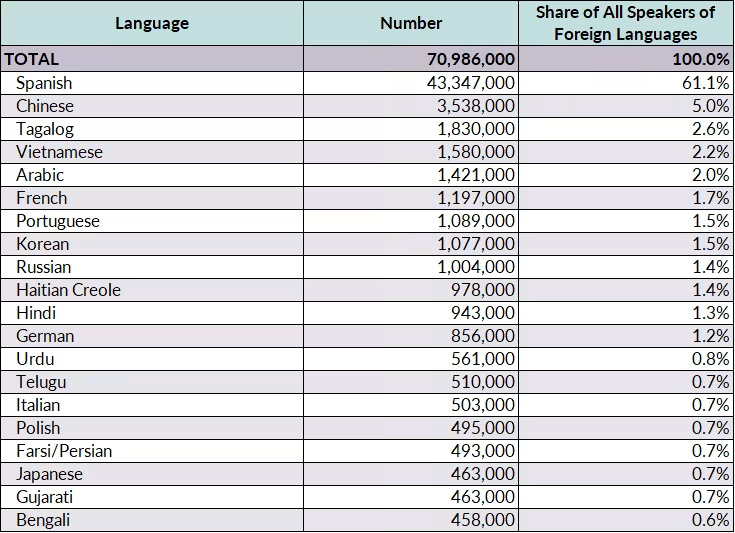
Among the nearly 71 million people who reported speaking a language other than English at home, 61 percent spoke Spanish. Other top languages were Chinese (including Mandarin and Cantonese, 5 percent); Tagalog (almost 3 percent); and Vietnamese, Arabic, and French (including Cajun; about 2 percent each; see Table 1).
Table 1. Top Languages Other than English Spoken at Home by U.S. Residents (ages 5 and older), 2023
Note: Chinese includes Mandarin and Cantonese, French includes Cajun, Portuguese includes Cape Verdean Creole, and Tagalog includes Filipino.
Source: MPI analysis of data from the U.S. Census Bureau 2023 ACS, accessed from IPUMS USA, University of Minnesota, available online.
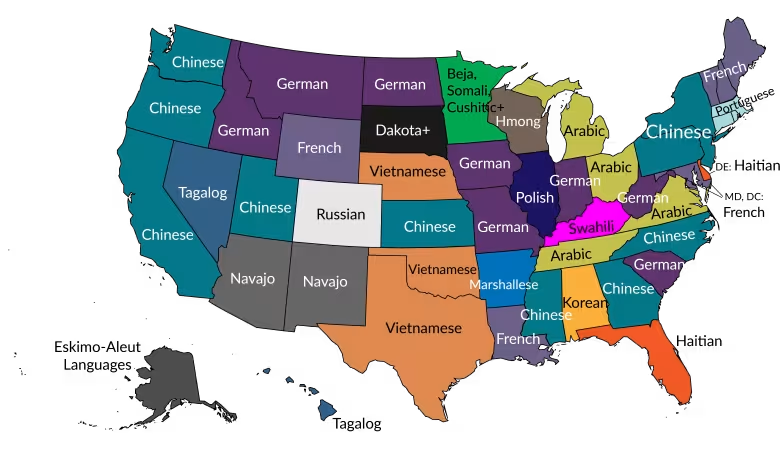
Aside from English, Spanish was the most commonly spoken language at home in all but three states: Alaska (Eskimo–Aleut languages), Hawaii (Tagalog), and Maine (French). Not including English or Spanish, the following languages were among the common: Chinese (in 11 states), German (in eight states), French (in seven states), Arabic (in four states), and Vietnamese and Portuguese (in three states each; see Figure 3).
Figure 3. Map of Most Commonly Spoken Languages Other than English and Spanish, by U.S. State, 2023
Notes: Chinese includes Mandarin and Cantonese; Dakota+ includes Dakota, Lakota, Nakota, and Sioux; French includes Cajun; Portuguese includes Cape Verdean Creole; and Tagalog includes Filipino.
Sources: MPI analysis of data from the U.S. Census Bureau 2023 ACS, accessed from IPUMS USA.
How many immigrants have limited proficiency in English?
In 2023, 47 percent (22.3 million) of all 47.5 million immigrants ages 5 and older spoke English less than “very well,” accounting for about 81 percent of the country’s 27.6 million individuals with limited proficiency in English.
What share of the immigrant population has a college degree?
In 2023, 35 percent of all 42.2 million immigrant adults ages 25 and older had a bachelor’s degree or higher, a rate similar to that of U.S.-born adults (see Figure 4). Newer arrivals tend to be better educated; 46 percent of immigrants who entered the country between 2020 and 2023 held at least a bachelor’s degree.
Figure 4. Educational Attainment of the U.S. Population (ages 25 and older), by Origin, 2023
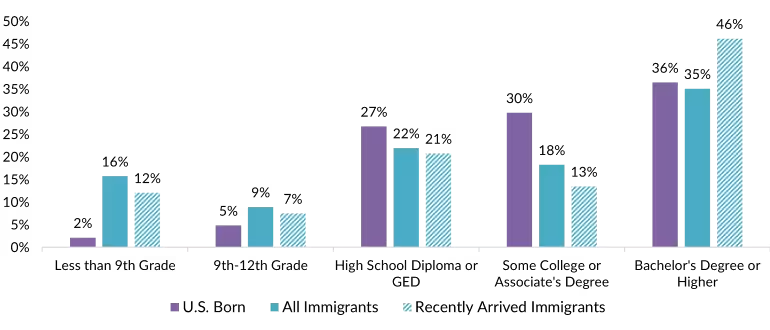
Note: Recently arrived immigrants are those who entered the United States between 2020 and 2023.
Source: MPI tabulation of data from the U.S. Census Bureau 2023 ACS.
Educational attainment rates vary by country of origin. More than 70 percent of adults from the United Arab Emirates (89 percent), India (81 percent), Singapore and Taiwan (77 percent each), and Saudi Arabia (72 percent) had a bachelor’s degree or more in 2023. The college-educated share is also relatively high among Venezuelans (49 percent), who represent the fastest-growing U.S. immigrant group.
Among immigrants who arrived between 2020 and 2023, the share who were college graduates was the largest among Indians (87 percent) and Egyptians (86 percent), followed by those from Korea, Taiwan, and Spain (between 82 percent and 84 percent).
- Article: College-Educated Immigrants in the United States
- Data table: Educational Attainment among U.S.-Born Adults and All Immigrant Adults by Country of Birth in 2023
Definition
The civilian labor force is comprised of civilians ages 16 and older who were either employed or unemployed but looking for work in the week prior to participation in the ACS or decennial census.
How many immigrants are in the U.S. civilian labor force?
Immigrants constituted close to 18 percent (30.6 million people) of the 171.9 million people in the U.S. civilian labor force in 2023, which comprises both the employed and the unemployed looking for work. Immigrants’ share of the labor force has more than tripled since 1970, when they accounted for approximately 5 percent.
- Data tool: Immigrant Share of the U.S. Population and Civilian Labor Force, 1980-Present
- Explainer: Immigrants and the U.S. Economy
What types of jobs do immigrants do?
Of the 29.4 million employed foreign-born workers ages 16 and older in 2023, the largest share (38 percent) worked in management, professional, and related occupations (see Figure 5).
Figure 5. Employed Workers in the U.S. Civilian Labor Force (ages 16 and older), by Nativity and Occupation, 2023
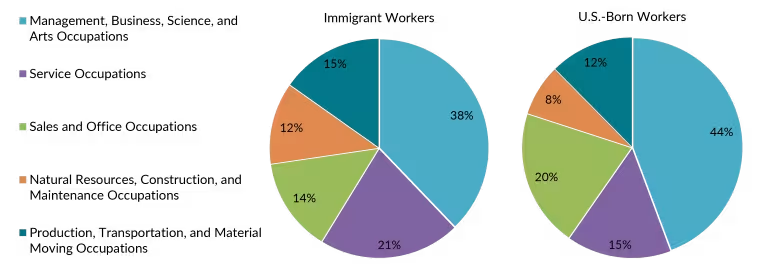
Note: Numbers may not add up to 100 as they are rounded to the nearest whole number.
Source: MPI tabulation of data from the U.S. Census Bureau 2023 ACS.
- Data table: State Immigration Data Profiles
What salaries do immigrants earn and are they likely to live in poverty?
Immigrants’ median household income in 2023 was approximately $78,700, slightly higher than that of U.S.-born households: $77,600.
At the same time, immigrants were slightly more likely to live in poverty than their U.S.-born counterparts (14 percent versus 12 percent; the U.S. Census Bureau defines poverty as having an income below $30,900 for a family of four in 2023.)
What share of immigrants have health insurance?
Approximately 57 percent of immigrants had private health insurance in 2023 (compared to 69 percent of the U.S. born), and 33 percent had public health insurance coverage (compared to 38 percent for the native born). Meanwhile, 18 percent lacked health insurance (compared to 6 percent of the U.S. born).
Note: Health insurance coverage is calculated only for the civilian, noninstitutionalized population. Since some people simultaneously hold both private and public health insurance coverage, the sum of these rates may be greater than the total share of people with health insurance.
How many U.S. residents are from immigrant families?
Immigrants and their U.S.-born children number more than 93 million people, or 28 percent of the total noninstitutionalized U.S. population in 2024. This is an increase of approximately 20 million (or 27 percent) from 2010.
How many U.S. children live with an immigrant parent?
Approximately 17.9 million U.S. children lived with at least one immigrant parent in 2023. They accounted for 26 percent of all 68.9 million children under age 18, up from 24 percent in 2010, 19 percent in 2000, and 13 percent in 1990.
Most of these children are U.S. born. Second-generation immigrant children (those under age 18 born in the United States with at least one immigrant parent) accounted for 86 percent (15.4 million) of all children with immigrant parents. The remaining 14 percent (2.5 million) were born abroad.
Note: These data include only children between ages 0 and 17 (regardless of nativity) who reside with at least one parent. The number of children shown here is therefore smaller than the overall number of U.S. children under 18.
- Data tool: Children in U.S. Immigrant Families
How has the number of children in immigrant families changed over time?
From 2022 to 2023, the number of children with immigrant parents grew slightly, from 17.6 million to 17.9 million. Despite a brief decline in recent years, the trend over the past decade has been one of growth. Between 2010 and 2023, the number of children with immigrant parents grew by about 6 percent, from just under 17 million. This was a significantly smaller rate of growth than during the 2000-10 era, when the number grew by 30 percent, from 13.1 million.
This growth has been driven by the increasing number of U.S.-born children with immigrant parents. Their numbers increased by 6 percent between 2010 and 2023 (from 14.6 million to 15.4 million) and 40 percent between 2000 (when they numbered 10.4 million) to 2010.
The number of first-generation immigrant children (those under age 18 who were born abroad to foreign-born parents) has also increased from 2.4 million in 2010 to 2.5 million 2023, following a 12 percent decline from 2000 (when they numbered 2.7 million) to 2010.
How many children living with immigrant parents are in low-income families?
Regardless of nativity, 24.3 million children under 18 lived in families with incomes below 200 percent of the federal poverty threshold in 2023 ($61,800 for a family of four with two children). Of them, 7.5 million (31 percent) had one or more foreign-born parents.
Of the 17.9 million children of immigrants, 42 percent were in low-income families, a higher rate than for children of U.S.-born parents (33 percent of 51 million).
- Data table: State Immigration Data Profiles
Top U.S. Destinations
Which U.S. states and cities have the most immigrants?
The U.S. states with the most immigrants in 2023 were California (10.6 million), Texas (5.5 million), Florida (5 million), New York (4.5 million), and New Jersey (2.3 million). As a percentage of the total population, immigrants made up the largest shares in California (27 percent), New Jersey (24 percent), New York (23 percent), Florida (22 percent), and Nevada (19 percent).
In terms of cities, the New York City metropolitan area was home to the most immigrants (approximately 5.9 million), as of the 2019-23 period, followed by the greater Los Angeles (4.2 million), Miami (2.6 million), and Houston and Chicago (1.7 million each) areas (see Figure 6). Nearly 42 percent of Miami’s population was born abroad, the highest share in the country.
Figure 6. Metropolitan Areas of Residence for U.S. Immigrants, 2019-23
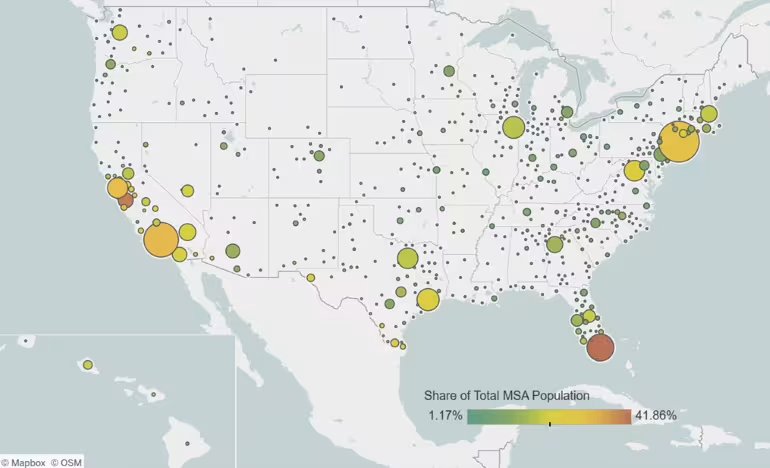
Note: Not shown is the population in Alaska, which is small in size.
Source: MPI tabulation of data from the U.S. Census Bureau pooled 2019-23 ACS.
- Data tool: Immigrant Population by State, 1990-Present
- Interactive map: U.S. Immigrant Population by State and County
- Interactive map: U.S. Immigrant Population by Metropolitan Area
Which states have experienced the fastest growth of their immigrant populations?
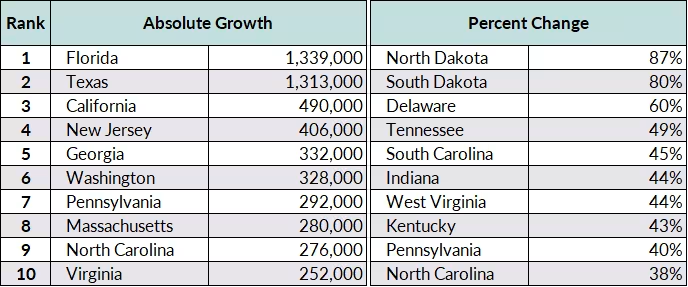
The traditional immigrant destinations Florida and Texas gained the largest absolute number of new immigrants from 2010 to 2023, but other states have seen much larger relative growth. In some cases, this is because the states’ initial foreign-born populations were quite small, so a relatively small absolute increase has translated into high-percentage growth (see Table 2). For instance, more immigrants (1.3 million) moved to Florida between 2010 and 2023 than any other state, but the size of the immigrant population in North Dakota grew by the largest relative share (87 percent).
Table 2. Top U.S. States by Absolute and Relative Immigrant Population Growth, 2010-23
Source: MPI tabulation of data from the U.S. Census Bureau 2010 and 2023 ACS.
Where do most children in immigrant families live?
In terms of absolute numbers, the top states for children under age 18 living with an immigrant parent in 2023 were California (3.7 million), Texas (2.4 million), Florida (1.5 million), New York (1.4 million), and New Jersey (792,000). These states accounted for 54 percent of the 17.9 million U.S. children with immigrant parents.
As a share of all children, the top states for those with immigrant parents in 2023 were California (where 46 percent of all children had an immigrant parent), New Jersey (41 percent), New York (37 percent), and Florida and Nevada (35 percent each).
Which states have experienced the fastest growth of the number of children in immigrant families?
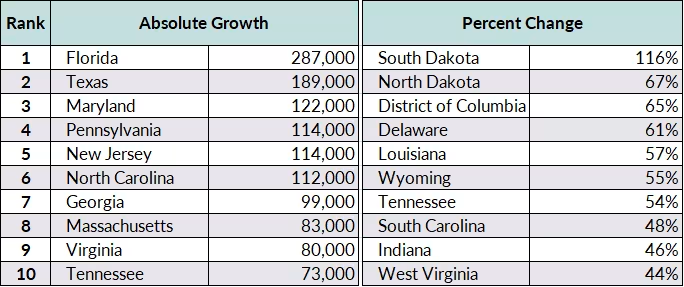
Florida and Texas experienced the largest absolute growth in the number of children with an immigrant parent between 2010 and 2023, but other states have seen much larger relative growth (see Table 3). In states such as South Dakota, the initial number of children with immigrant parents was quite small, so relatively small absolute increases have translated into high-percentage growth.
Table 3. Top U.S. States by Absolute and Relative Growth in Number of Children with Immigrant Parents, 2010-23
Source: MPI tabulation of data from the U.S. Census Bureau 2010 and 2023 ACS.
Permanent Immigration and Naturalization
How many immigrants obtain a green card?
In fiscal year (FY) 2023, close to 1.2 million immigrants became lawful permanent residents (LPRs, also known as getting a green card). This was a 15 percent increase from the 1 million green cards issued in FY 2022 and a 66 percent increase over the 707,000 issued in FY 2020, which covered part of the Trump administration and the first few months of the COVID-19 pandemic.
The lower numbers in FY 2020 and FY 2021 (740,000) were largely due to the fewer green cards granted to individuals living outside the United States, amid processing delays and other interruptions during the pandemic. In the past decade, immigrants obtaining a green card have been about evenly divided between those already living in the United States who are adjusting their status and those applying from abroad. Just 31 percent of new green cards in FY 2021 were issued to applicants abroad; that share increased to 48 percent in FY 2023, in line with pre-pandemic levels. Of the 564,700 new green-card holders from abroad in FY 2023, 76 percent were immediate family members of U.S. citizens and LPRs.
Meanwhile, 52 percent (608,300) of new LPRs in FY 2023 received a green card from within the United States. Most of these new permanent residents were spouses, children, and parents of U.S. citizens and LPRs (54 percent), followed by people who obtained a green card through employment (24 percent) or adjusting from refugee or asylee status (16 percent).
- Data tool: Legal Immigration to the United States, 1820-Present
- Article: Antiquated U.S. Immigration System Ambles into the Digital World
What are the pathways to a green card?
There are four main pathways: through a family relationship, employment sponsorship, humanitarian protection (for refugees and asylees), and the Diversity Visa (DV) lottery (also known as the green-card lottery). Some categories within these pathways have annual caps.
Of the 1.2 million immigrants receiving a green card in FY 2023, 47 percent were immediate relatives of U.S. citizens (an uncapped visa category) and 17 percent were in family categories that are limited by visa and country caps (see Figure 7). About 17 percent of new LPRs were sponsored by their employer or self-petitioned (including investors who create jobs), a decline from 27 percent of new LPRs in FY 2022 (see Figure 7).
Figure 7. Immigration Pathways of New Lawful Permanent Residents in the United States, FY 2023
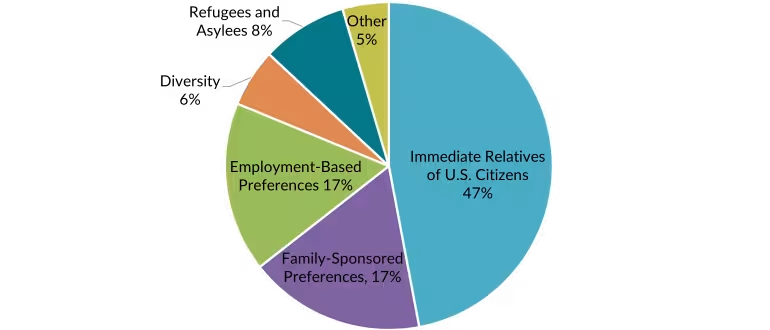
Notes: Immediate Relatives of U.S. Citizens: Includes spouses, minor children, and parents of U.S. citizens. Family-Sponsored Preferences: Includes adult children and siblings of U.S. citizens as well as spouses and children of green-card holders. The Diversity Visa lottery allows entry to immigrants from countries with low rates of immigration to the United States; 55,000 diversity visas are made available each fiscal year. Percentages may not add up to 100 as they are rounded to the nearest whole number.
Source: MPI tabulation of data from Department of Homeland Security (DHS), “Table 10D: Persons Obtaining Lawful Permanent Resident Status by Broad Class of Admission and Region and Country of Birth: Fiscal Year 2023,” updated November 8, 2024, available online.
What are the most common countries of origin for new permanent immigrants?
The top countries of birth for new LPRs in FY 2023 were Mexico (15 percent), Cuba and India (7 percent each), the Dominican Republic (6 percent), mainland China (5 percent), the Philippines (4 percent), Vietnam and Afghanistan (3 percent apiece), and Brazil and El Salvador (2 percent each). Together, these 10 countries were the origin of about 54 percent of all new green-card recipients in FY 2023.
How many people are selected in the Diversity Visa lottery and where are they from?
The lottery is available to individuals from countries with low rates of immigration to the United States. Created in 1990, the lottery sets aside 55,000 green cards annually, of which 5,000 must be used for applicants under the Nicaraguan Adjustment and Central American Relief Act of 1997.
Interest in the lottery is significantly higher than the number of available visas. More than 9.6 million qualified applications were filed for the 2023 lottery—higher than the 6.7 million filed for the 2021 lottery but fewer than the 14.4 million for 2019. (The number of applications varies in part because the list of eligible countries is modified annually.) Before receiving permission to immigrate, lottery winners must provide proof of a high school education or its equivalent or show two years of work experience within the past five years in an occupation that requires at least two years of training or experience. They also must pass a medical exam and a background check.
In FY 2023, 67,350 people received a green card as diversity immigrants, representing 6 percent of all 1.2 million new LPRs. The leading countries of birth were Nepal and Algeria (6 percent each), Morocco and Russia (5 percent each), and Egypt (4 percent); together, these countries accounted for 26 percent of all diversity visa recipients that year.
For some countries, the lottery is responsible for a majority of all new LPRs. For example, 78 percent of all nationals of Algeria and 74 percent of those from Tajikistan and Kyrgyzstan who obtained a green card in FY 2023 did so through the lottery.
- State Department Visa Bulletin
- DHS report: 2023 Yearbook of Immigration Statistics
How many immigrants are naturalized citizens?
Close to 25 million immigrants were naturalized U.S. citizens as of 2023, accounting for 7 percent of the total U.S. population (334.9 million).
Of these, 42 percent were naturalized in 2010 or later, 24 percent between 2000 and 2009, and 34 percent prior to 2000.
In general, the requirements for naturalization are being at least 18 years of age, passing English and civic exams, and residing in the United States with LPR status continuously for at least five years (three years for those married to a U.S. citizen).
How many immigrants become U.S. citizens annually?
About 818,500 green-card holders became naturalized citizens in FY 2024, a 7 percent decrease from the 878,500 in FY 2023.
From a historical perspective, the number of annual naturalizations has increased dramatically in recent decades. On average, fewer than 115,000 LPRs became citizens each year between FY 1950 and FY 1969, 145,000 in the 1970s, 210,000 in the 1980s, 500,000 in the 1990s, 685,000 during the 2000s, and about 730,000 between 2010 and 2019. Naturalizations reached an all-time high of 1,047,000 in FY 2008, as a result of impending application fee increases and the promotion of U.S. citizenship.
The amount of time U.S. Citizenship and Immigration Services (USCIS) takes to process naturalization applications increased from an average of 5.6 months in FY 2016 to 11.5 months in FY 2021 but then declined to 5.5 months as of January 2025.
- Data tool: Naturalization in the United States, 1910-Present
- Article: Naturalized Citizens in the United States
- USCIS data: Historical National Average Processing Time for All USCIS Offices
- USCIS fact sheet: Military Naturalization Statistics
Where in the United States do newly naturalized citizens live?
About 56 percent of people naturalized as U.S. citizens in FY 2024 lived in one of five states: California (18 percent), Florida and New York (11 percent apiece), Texas (10 percent), and New Jersey (6 percent).
The top metropolitan areas with the largest number of new naturalizations were the greater New York (14 percent), Miami and Los Angeles (7 percent each), Washington, DC (4 percent), and Houston (3 percent) metropolitan areas. These six metro areas were the home to 35 percent of all immigrants who became citizens in FY 2024.
How many green-card holders are eligible to naturalize?
About 8.7 million of the 12.8 million green-card holders in the United States as of January 2024 were eligible to become U.S. citizens based on how long they had held LPR status, according to the most recent DHS estimates. The top nationalities for those eligible to naturalize were Mexico (2.3 million), mainland China (560,000), the Dominican Republic (390,000), Cuba (370,000), and the Philippines (330,000).
- DHS report: Estimates of the Lawful Permanent Resident Population in the United States and the Subpopulation Eligible to Naturalize: 2024 and Revised 2023
- USCIS data: Eligible to Naturalize Dashboard
How long does it take on average for green-card holders to naturalize?
On average, immigrants who became U.S. citizens in FY 2024 had previously held green cards for 7.5 years, a decrease from an average of eight years during the FY 2017-19 period.
The time varied by place of origin. In FY 2024, immigrants from Mexico spent nearly 11 years on average in LPR status before naturalization, while those from China spent nearly eight years and those from India spent about six years.
- USCIS fact sheet: Naturalization Statistics
Notes on Visa Backlogs
Two types of backlogs impact the issuance of green cards.
The first is due to visa availability, which for some categories is limited by caps established in 1990:
- Family-sponsored preferences are limited to 226,000 visas per year.
- Employment-based permanent visas for foreign workers and their families are capped at 140,000 per year.
- No country can be the origin for more than 7 percent of the total annual number of family-sponsored and employment-based visas (approximately 25,600 visas).
The second type of backlog is due to delays processing applications, which is related to government capacity as well as increased background and criminal checks.
How many visa applications for lawful permanent residence are backlogged?
Because of limits on certain visa categories and per-country caps, the U.S. government in some cases is still processing applications from 25 years ago. In March 2025, the State Department was processing some family-sponsored visa applications filed in November 2000 and employment-related visa applications submitted in December 2012.
According to the most recent available data, more than 4 million applicants (including spouses and minor children) were on the State Department’s immigrant visa waiting list as of November 1, 2023. (This number does not include prospective immigrants already in the United States waiting to adjust their status.) The overwhelming majority of applications in this backlog were from family-sponsored applicants (more than 3.8 million, including principal applicants and their immediate family members), while about 261,000 were applicants for employment-sponsored channels and their families. Of the overall 4 million applicants, the largest number (1.2 million) were citizens of Mexico, followed by those from India (291,000), the Philippines (288,000), the Dominican Republic (251,000), and mainland China (231,000).
USCIS also publishes backlog statistics for petitions approved in one of the five employment-based categories. As of September 2024, nearly 785,000 approved employment-based immigrant petitions were awaiting an open visa slot.
- Explainer: How the U.S. Legal Immigration System Works
- State Department Visa Bulletin
- State Department report: Annual Report of Immigrant Visa Applicants in the Family-sponsored and Employment-based preferences Registered at the National Visa Center as of November 1, 2023
- USCIS Employment-based immigrant petition backlog data
Refugees and Asylum Seekers
Notes on Refugees, Asylum Seekers, and Asylees
In the United States, the main difference between a refugee and an asylum seeker is the person's location at the time of application. Refugees are nearly always outside the United States when considered for resettlement, whereas asylum seekers submit their applications while physically present in the United States or at a port of entry. Individuals granted asylum are called asylees.
Asylum seekers submit an asylum request either affirmatively or defensively, based on their circumstances. The affirmative asylum process applies to people who file an asylum application with U.S. Citizenship and Immigration Services (USCIS) within one year of U.S. arrival and are not in removal proceedings. The defensive asylum process applies to those crossing the border without authorization or who are in the United States and placed into removal proceedings in immigration court.
How many refugees are resettled each year, and where are they from?
Every year, the president in consultation with Congress sets the annual refugee admissions ceiling and allocations by region of origin. Since the formal creation of the modern resettlement program in 1980, the lowest limit was set by the first Trump administration for FY 2021, at 15,000. The Biden administration set the ceiling at 125,000 each for FY 2022-25. This number is a ceiling, and the number of resettled refugees rarely reaches this limit. In FY 2024, more than 100,000 refugees were resettled, the most in 30 years. At the start of his second term on January 20, 2025, President Donald Trump suspended the program indefinitely.
Overall, nearly 3.7 million refugees were resettled between FY 1980 and the first quarter of FY 2025.
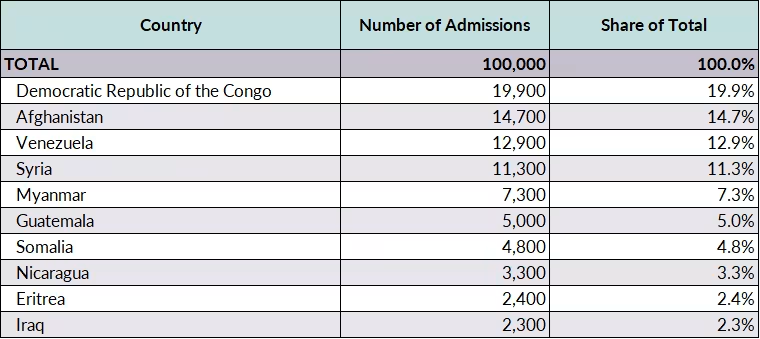
For refugees arriving in FY 2024, primary countries of nationality were the Democratic Republic of the Congo, Afghanistan, Venezuela, Syria, and Myanmar (also known as Burma). Combined, the 66,100 refugees from these countries accounted for 66 percent of all refugees resettled that year. The nearly 83,900 nationals of the top 10 countries comprised 84 percent of all refugee arrivals in FY 2024 (see Table 4).
Table 4. Top Countries of U.S. Refugee Admissions, by Nationality, FY 2024
Source: MPI tabulation of U.S. State Department, Bureau of Population, Refugees, and Migration, “Summary of Refugee Admissions,” updated January 5, 2025, available online.
- Article: Refugees and Asylees in the United States
- Article: How the Rebuilt U.S. System Resettled the Most Refugees in 30 Years
- Data tool: U.S. Annual Refugee Resettlement Ceilings and Number of Refugees Admitted, 1980-Present
- State Department’s Refugee Processing Center data: Admissions and Arrivals
What are the most common religions of admitted refugees?
Refugees identifying as Christian comprised 52 percent of resettled refugees in FY 2024, while Muslims comprised 42 percent. The remainder included Buddhists (1 percent), Hindus and Jews (0.1 percent combined), and those who reported no religious affiliation or being atheists (about 5 percent).
Overall, the largest share of refugees resettled tend to be Christians. Between FY 2010 and FY 2024, Christians represented 49 percent (390,800) of the 798,000 refugees, compared to 36 percent (283,000) who were Muslim.
Note: Refugee demographic data are based on self-identification, so religious breakdowns include major religions as well as denominations.
- State Department data: Refugee Arrivals Fiscal Year by Nationality and Religion Group and Religion
How many asylum applications are filed annually?
In FY 2024, approximately 420,000 affirmative applications were received by USCIS, down from the record high 455,000 received a year earlier.
Meanwhile, nearly 851,000 new defensive asylum applications were received by the immigration courts (formally the Executive Office of Immigration Review, or EOIR) in FY 2024. This was by far the most on record and marks a significant increase from the 483,000 applications filed the prior year.
What is the current asylum application backlog?
Due to the large application volume and limited resources, both the affirmative and defensive asylum systems have extensive backlogs. At USCIS, 1.3 million asylum applications were pending at the end of FY 2024, up from 1 million a year earlier. In FY 2024, nearly 1.5 million asylum cases were pending in the immigration courts, up from 1.4 million a year earlier.
How many people receive asylum?
In FY 2023, 54,350 individuals were granted asylum, including principal applicants, their spouses, and unmarried children under age 21. This was the most since at least FY 1990 and a 228 percent increase from the decade-low of 16,600 grants in FY 2021. Of new asylees, 22,300 were granted asylum affirmatively and 32,050 defensively.
In FY 2023, an additional 4,800 individuals received derivative asylum status as immediate family members of principal applicants and 13,900 were approved for derivative status outside the United States. (This number reflects travel documents issued to these family members, not necessarily their arrival in the United States.)
From which countries do most asylum seekers originate?
Afghanistan was the top origin for those receiving asylum in FY 2023, with 14,500 people (close to 27 percent of total asylum grants), followed by mainland China (4,900, or 9 percent), Venezuela (3,800, or 7 percent), El Salvador (3,000, or 6 percent), and India (2,700, or 5 percent). Together, nationals of these countries made up 53 percent of new asylees in FY 2023.
- Report: Outmatched: The U.S. Asylum System Faces Record Demands
- USCIS affirmative asylum quarterly reports
- EOIR data: Workload and Adjudication Statistics
- DHS's Office of Homeland Security Statistics report: 2023 Asylees Annual Flow Report
Temporary Visas
Definition
Nonimmigrants are citizens of other countries who come to the United States temporarily for a specific purpose, such as education or tourism. There are more than 80 classes of nonimmigrant visas, including temporary workers and trainees, intracompany transferees, international students, visitors for business or for pleasure, and foreign government officials. Most classes of nonimmigrants must have a permanent home abroad; most can be accompanied by a spouse and minor children.
How many nonimmigrant visas does the State Department issue each year?
The State Department issued close to 11 million temporary visas in FY 2024, an increase over the 10.4 million in FY 2023 and 8.7 million in pre-pandemic FY 2019. In FY 2021, the public-health crisis and the Trump administration travel ban contributed to the issuance of just 2.8 million nonimmigrant visas, the fewest since FY 1996. Since the pandemic, the State Department has issued nonimmigrant visas at a faster rate in categories for students, temporary workers, trainees, and their family members, waiving the interview requirement to reduce wait times.
Seventy-seven percent of nonimmigrant visas issued in FY 2024 were temporary business and tourist visas (B and BCC visas). The next largest visa class was for temporary workers and trainees and their family members (H visa categories; 7 percent), followed closely by academic students and exchange visitors and their family members (F and J visa categories; 7 percent).
Note: The number of visas issued does not necessarily match the number of foreign nationals who entered the United States because some nonimmigrant visas may not be used.
How many temporary employment-based visas does the State Department issue each year?
In FY 2024, the State Department issued nearly 1.2 million employment-based temporary visas for foreign workers (along with immediate family members) in multiple categories, down from 1.3 million in FY 2023 but up from 965,000 in FY 2019. Among these were approximately 315,000 H-2A seasonal agriculture worker visas, 223,000 H-1B specialty occupation worker visas, 140,000 H-2B seasonal nonagricultural worker visas, and 72,000 L-1 intracompany transferee visas.
Note: Temporary workers and trainees include workers in specialty occupations (H-1B visa), seasonal agricultural workers (H-2A), seasonal nonagricultural workers (H-2B), workers with extraordinary ability or achievements (O-1 and O-2), athletes and artists (P-1, P-2, and P-3), intracompany transferees (L-1), treaty traders and investors (E-1, E-2, and E-3), people working for employers in the Commonwealth of the Northern Mariana Islands and their immediate families (CW-1 and CW-2), representatives of foreign information media (I-1), workers in international cultural exchange programs (Q-1), workers in religious occupations (R-1), and TN visas reserved for Canadian and Mexican professionals, as well as their spouses and minor children.
- Article: Temporary Visa Holders in the United States
- Article: International Students in the United States
- State Department data: FY2024 NIV Workload by Visa Category
- State Department fact sheet: Visa Denials
How many nonimmigrant admissions does the Department of Homeland Security grant each year?
Foreign nationals were admitted into the United States for nonimmigrant purposes 132.4 million times in FY 2023—much higher than the 96.8 million in FY 2022 but still below the 186.2 million in FY 2019. Of these FY 2023 admissions, 48 percent (64.2 million) were Canadians and Mexicans traveling for business or pleasure, who are exempt from completing the I-94 arrival/departure form at the port of entry; DHS does not provide characteristics for this group.
The remaining 68.3 million temporary admissions were of nonimmigrants who filled out the I-94 form. Most of these were tourists (78 percent) or business travelers (10 percent), followed by temporary workers and their families (7 percent; see Table 5).
Table 5. U.S. Nonimmigrant Admissions by Category, FY 2023 (I-94 only)
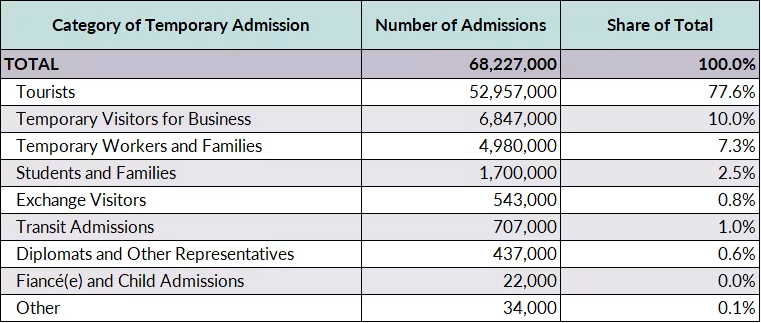
Notes: Nonimmigrant admissions represent the number of entries; individuals may have multiple entries within the year. The Department of Homeland Security (DHS) Office of Homeland Security Statistics only reports characteristics of nonimmigrants who must complete an I-94 arrival/departure form at entry.
Source: MPI tabulation of data from DHS, 2023 Yearbook of Immigration Statistics (Washington, DC: DHS, Office of Homeland Security Statistics, 2024), available online.
Often, temporary visitors stay in the United States for only a short period, such as for the duration of their vacation or business trip.
- DHS data: Nonimmigrant admissions
Unauthorized Immigration and Enforcement
How many unauthorized immigrants are there?
MPI estimates there were about 13.7 million unauthorized immigrants in the United States in mid-2023, up from 12.8 million in 2022. The unauthorized population was largely stable in size from 2007 to 2021 but grew following the large number of border arrivals post-pandemic.
Note: The size of the unauthorized population is affected by arrivals as well as departures, deaths, or in certain cases adjustments to legal status.
What are unauthorized immigrants’ top regions and countries of birth?
Mexicans and Central Americans accounted for 68 percent (9.3 million) of all U.S. unauthorized immigrants in 2023, according to MPI estimates. Close to 12 percent (1.7 million) were from South America; 7 percent (896,000) from Europe, Canada, or Oceania; about 6 percent (851,000) from Asia; 4 percent (575,000) from the Caribbean; and 3 percent (415,000) from Africa.
The top countries of birth were Mexico (40 percent, or 5.5 million), Guatemala (10 percent, or 1.4 million), Honduras and El Salvador (8 percent, or 1.1 million each), and Venezuela (4 percent, or 486,000).
- MPI’s latest estimates: The Unauthorized Immigrant Population Expands amid Record U.S.-Mexico Border Arrivals.
How many unauthorized immigrants hold DACA, TPS, and other “twilight” status?
In recent years, a rapidly growing number of migrants hold or arrive with a liminal legal status that may offer protection from deportation and the right to work but does not lead to a green card. Among this population of unauthorized immigrants with “twilight” statuses are individuals who entered through humanitarian parole, including those arriving at the U.S.-Mexico border after making an appointment with the CBP One app and those coming through nationality-specific programs such as for Afghans, Ukrainians, and Cubans, Haitians, Nicaraguans, and Venezuelans (referred to as the CHNV program). Combined with unauthorized immigrants benefitting from the Deferred Action for Childhood Arrivals (DACA) program, Temporary Protected Status (TPS), and similar policies, as many as 3.8 million people held some form of liminal status in 2024 (see Table 6).
Table 6. Unauthorized Immigrants with Liminal Statuses, 2024
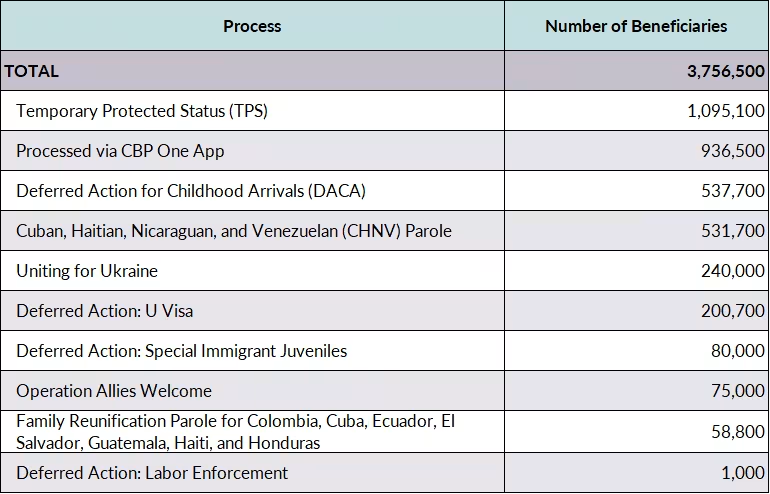
Notes: Table shows the number of grants of status, including renewals or extensions of status, and not the number of people with twilight statuses, since some individuals may hold multiple statuses. Data are not available for grants of deferred action T visas or Parole in Place for Spouses, the latter of which was vacated by a federal court in Texas in November 2024. The number of holders of Temporary Protected Status (TPS) is as of September 2024. CBP One numbers are for scheduled appointments made through the app as of December 2024; not every appointment results in an individual being processed into the country. Data for the CBP One app and the Cuban, Haitian, Nicaraguan, and Venezuelan (CHNV) parole program are through December 2024. The number of holders of Deferred Action for Childhood Arrivals (DACA) is as of September 2024. The Uniting for Ukraine number is as of February 2025 and includes 20,000 Ukrainians paroled at the border before the program was created in April 2022. The number of Afghans assisted through Operation Allies Welcome is as of March 1, 2023. The number of recipients of deferred action for Special Immigrant Juveniles (SIJs) is as of April 2023. Deferred action for U visa applicants reflects the number of holders as of September 2024. Numbers for the SIJs and U visa deferred action indicate the number of people initially granted deferred action. Some parolees and grantees of deferred action may have obtained a different immigration status, including asylum, TPS, or lawful permanent residence.
Sources: Jill H. Wilson, Temporary Protected Status and Deferred Enforced Departure (Washington, DC: Congressional Research Service, 2024), available online; U.S. Customs and Border Protection (CBP), "CBP Releases December 2024 Monthly Update" (press release, January 14, 2025) available online; Office of the Citizenship and Immigration Services Ombudsman (CIS Ombudsman), Annual Report 2023 (Washington DC: CIS Ombudsman, 2024), available online; Camilo Montoya-Galvez, “U.S. Pauses Immigration Applications for Certain Migrants Welcomed under Biden,” CBS News, February 19, 2025, available online; U.S. Citizenship and Immigration Services (USCIS), “Count of Active DACA Recipients by Month of Current DACA Expiration as of September 30, 2024,” updated December 2024, available online; Declaration of Royce Bernstein Murray, Las Americas Immigration Advocacy Center et al. v. U.S. Department of Homeland Security et al., filed August 16, 2024, available online; DHS, “DHS Support of the Enforcement of Labor and Employment Laws,” updated July 23, 2024, available online.
Approximately 1.1 million individuals held TPS as of September 2024. Since the Immigration Act of 1990, the U.S. government has occasionally granted TPS when the origin countries of foreign nationals already in the United States experience natural disasters, armed conflicts, or other circumstances making return unsafe. TPS offers work authorization and protection from deportation for periods of six months to 18 months. El Salvador was the first country to be designated for TPS in 1990, to protect Salvadorans who had fled its civil war. Seventeen countries were designated for TPS as of the end of 2024. The largest number of beneficiaries are from Venezuela (505,400), Haiti (260,800), and El Salvador (174,200)
The DACA program, created in 2012, offers two years of deportation relief and work authorization to unauthorized immigrants who entered the United States before age 16 and meet other conditions. The Trump administration attempted to terminate DACA in 2017, but after multiple court challenges the program has remained alive, albeit closed to new entrants. Between August 15, 2012 (when DACA began) and September 30, 2024, approximately 835,000 applicants were approved, suggesting this is the maximum number of people who have ever benefitted from DACA.
USCIS reports that 537,700 individuals were enrolled in DACA as of September 30, 2024. The top states of residence for active DACA participants were California (28 percent), Texas (17 percent), and Illinois (5 percent), followed by Florida, New York, North Carolina, and Arizona (about 4 percent each). DACA participants’ top countries were Mexico (81 percent), El Salvador (4 percent), Guatemala (3 percent), Honduras (2 percent), and Peru, South Korea, Brazil, Ecuador, and Colombia (about 1 percent each).
- Article: In the Twilight Zone: Record Number of U.S. Immigrants Are in Limbo Statuses
- Data tool: Deferred Action for Childhood Arrivals (DACA) Data Tools
- Congressional Research Service report: Temporary Protected Status and Deferred Enforced Departure
- USCIS data: DACA applications and approvals
Definition
The Department of Homeland Security (DHS) uses the term encounters to include apprehensions and expulsions of migrants at the Southwest border. Historically, migrants caught crossing the border without authorization have been apprehended and processed under Title 8, but under the COVID-19-related Title 42 public-health order in effect from March 2020 to May 2023, migrants were immediately expelled approximately 2.8 million times.
Encounters are events, not individuals. In other words, the same individual can be encountered more than once, with each encounter counted separately.
How many times are unauthorized migrants encountered at the border each year?
U.S. Customs and Border Protection (CBP) reported 2.9 million migrant encounters at U.S. borders, airports, and seaports in FY 2024, down from a record high 3.2 million in FY 2023. The vast majority (2.1 million) were at the U.S.-Mexico border.
- Short read: With New Strategies At and Beyond the U.S. Border, Migrant Encounters Plunge
- Report: Migration at the U.S.-Mexico Border: A Challenge Decades in the Making
- Report: Shifting Realities at the U.S.-Mexico Border: Immigration Enforcement and Control in a Fast-Evolving Landscape
- Article: Biden’s Mixed Immigration Legacy: Border Challenges Overshadowed Modernization Advances
- Article: Title 42 Postmortem: U.S. Pandemic-Era Expulsions Policy Did Not Shut Down the Border
- CBP data: Nationwide Encounters
How many families and unaccompanied children have been encountered at the U.S.-Mexico border?
In FY 2024, authorities recorded 804,000 encounters of individuals traveling in “family units” (children under 18 and a parent or legal guardian travelling as families) at the U.S.-Mexico border, down from 822,000 in FY 2023. The top origin countries were Mexico (35 percent), Venezuela (13 percent), and Guatemala (9 percent).
There were also 110,000 encounters of unaccompanied minors at the U.S.-Mexico border in FY 2024, down from 137,000 the previous year. Most unaccompanied children were from Mexico (30 percent), Guatemala (28 percent), or Honduras (18 percent).
Overall, of the nearly 2.1 million migrant encounters at the southern border in FY 2024, single adults accounted for 57 percent, followed by people traveling in family units (38 percent), and unaccompanied minors (5 percent). This represents a slight shift from the year before, when there was a higher share of single adults (61 percent) and a lower share of families (33 percent).
- CBP data: Nationwide Encounters
- CBP data: CBP Enforcement Statistics
How many noncitizens are arrested by U.S. Immigration and Customs Enforcement each year?
U.S. Immigration and Customs Enforcement (ICE) made 113,000 administrative arrests of potentially removable noncitizens in FY 2024, down 34 percent from 171,000 the year before.
How many people are deported yearly?
DHS (both ICE and CBP) carried out 685,000 deportations in FY 2024, most of which were of individuals who recently crossed the border irregularly. ICE conducted 271,000 removals to more than 192 countries in FY 2024, almost double the number (143,000) the year before.
The number of deportations in FY 2024 was a 47 percent increase over the 466,000 deportations the prior year, but also represented the first full fiscal year since FY 2019 in which authorities did not expel recent unauthorized border crossers under the pandemic-related Title 42. The total number of repatriations (including deportations and expulsions) in FY 2024 was a 34 percent decline from the more than 1 million in FY 2023.
- Explainer: ICE Arrests and Deportations from the U.S. Interior
- Article: Comparing the Biden and Trump Deportation Records
- Article: Trump Administration Bends U.S. Government in Extraordinary Ways towards Aim of Mass Deportations
- ICE report: Fiscal Year 2024 Annual Report
- DHS data: DHS Repatriations by Type: Fiscal Years 2014 to 2025 YTD (November 2024)

Related Content


