Unauthorized Immigrants in the United States: Stable Numbers, Changing Origins
Related Content
Highlights
As of 2018, the unauthorized immigrant population in the United States held at 11 million, with origins shifting away from Mexico toward Asia and Central America.
- MPI estimates the unauthorized immigrant population reached 11 million in 2018, down from a peak of 12.3 million in 2007, stabilized by the recession, stepped-up enforcement, and improved conditions in Mexico.
- Mexicans still comprised about half of all unauthorized immigrants in 2018, but their share fell from 62 percent to 51 percent since 2007, while unauthorized immigrants from Asia grew from 7 percent to 14 percent.
- As of 2018, 4.4 million U.S.-citizen children had at least one unauthorized immigrant parent, and 1.6 million unauthorized immigrants were married to U.S. citizens.
The size of the unauthorized immigrant population in the United States has largely stabilized in recent years. After decades of growth that stretched into the early 2000s, this population contracted following the 2008–09 recession, before rebounding slightly. But even in this numerically stable, post-2008 period, there have been notable changes in the characteristics of this group. Among them: Mexican immigrants now make up a smaller (if still dominant) share of the unauthorized population, while immigrants from Asia and Central America account for growing shares.
Explore the Data
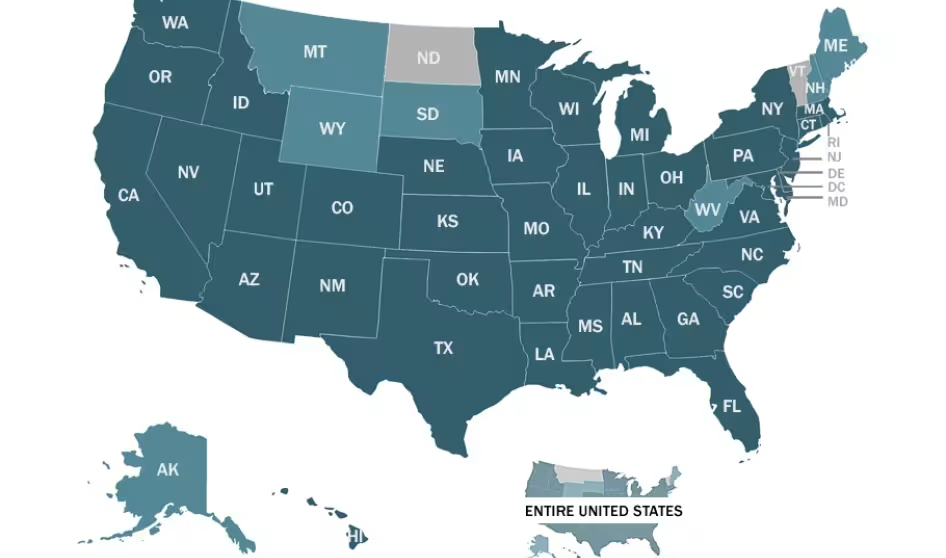
This fact sheet highlights top trends from MPI's interactive unauthorized immigrant data tool, which offers a detailed profile of unauthorized immigrants in the United States, 41 states and the District of Colombia, and the 127 counties with the largest unauthorized populations.
More data can be found through this interactive tool on the top countries and regions of origin for unauthorized immigrants, by U.S. state or county, and this tool on the top states of residence for DACA recipients.
As of 2018, there were 11 million unauthorized immigrants living in the country, according to Migration Policy Institute estimates developed using a unique methodology and the latest data from the U.S. Census Bureau and U.S. Department of Homeland Security.
This fact sheet sketches a profile of unauthorized immigrants in the United States, looking at their top countries and regions of origin; how they fit within the broader U.S. immigrant population; how many are part of mixed-status families; the U.S. states and counties where the largest numbers live; and key socioeconomic characteristics such as education, English proficiency, and family income levels.
Table of Contents
1 Introduction
2 Recent Trends in the Unauthorized Immigrant Population
3 National Origins of Unauthorized Immigrants
4 Unauthorized and Other Immigrants in the United States
5 Legal Status of Unauthorized Immigrants’ Family Members
6 Top U.S. States and Counties for Unauthorized Immigrants
7 Socioeconomic Characteristics of Unauthorized Immigrants
8 Conclusion
About the U.S. Immigration Policy Program
The U.S. Immigration Policy Program provides analysis of U.S. immigration pathways, the impacts of enforcement and other policies, and the characteristics of immigrant populations.





Related Content