Vietnamese Immigrants in the United States

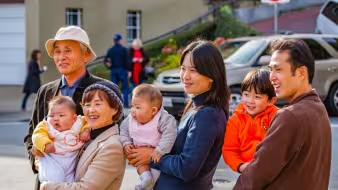
A Vietnamese family in the kitchen. (Photo: iStock.com/DragonImages)
Highlights
The U.S. Vietnamese immigrant population grew through post-war refugee arrivals. More recently, family-based immigration has predominated.
- More than 1.3 million Vietnamese immigrants lived in the United States in 2022, comprising the sixth-largest national-origin group.
- The population’s growth has slowed sharply, to just 7 percent between 2010 and 2022, compared to 26 percent the prior decade.
- In fiscal year (FY) 1982, 99 percent of Vietnamese immigrants entered on humanitarian grounds; by FY 2022, 87 percent received a green card through family reunification.
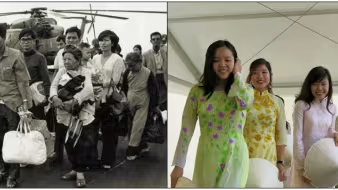
The end of the Vietnam War and the rapid U.S. military pullout in 1975 marked the beginning of large-scale migration from Vietnam to the United States. The U.S. government evacuated about 125,000 Vietnamese that year, most of whom had close ties to the U.S. military and could have been persecuted by the new Communist government. After their arrival, more Vietnamese refugees came to the United States seeking protection. The number of immigrants from Vietnam grew rapidly, roughly doubling in both the 1980s and 1990s, to 988,000 by 2000.
More than 1.3 million Vietnamese immigrants resided in the United States in 2022, the most recent year for which data are available from the U.S. Census Bureau American Community Survey (ACS), representing approximately 3 percent of all 46.2 million U.S. immigrants. They comprise the sixth-largest national-origin immigrant group, after Mexicans, Indians, Chinese, Filipinos, and Salvadorans. About 9 percent of immigrants from Asia in the United States in 2022 were from Vietnam.
Unlike in the past, when most Vietnamese came as refugees, today 87 percent of new Vietnamese lawful permanent residents (LPRs, also known as green-card holders) obtained their status through family reunification channels, either as immediate relatives of U.S. citizens or through other family-sponsored pathways. Compared to other immigrants, those from Vietnam are much more likely to be naturalized U.S. citizens and to have resided in the United States for a long period of time. They are also more likely to have lower levels of education and to report speaking English less than very well. Still, they report higher median household incomes than the overall immigrant and U.S.-born populations.
This Spotlight provides information on the Vietnamese immigrant population in the United States, focusing on its size, geographic distribution, and socioeconomic characteristics.
Definitions
The U.S. Census Bureau defines the “foreign born” as individuals who had no U.S. citizenship at birth. The foreign-born population includes naturalized citizens, lawful permanent residents, refugees and asylees, legal nonimmigrants (including those on student, work, or other temporary visas), and people residing in the country without authorization.
The terms “foreign born” and “immigrant” are used interchangeably and refer to those who were born in another country and later emigrated to the United States.
Click on the bullet points below for more information:
- Size of Immigrant Population over Time
- Distribution by U.S. State and Key Cities
- English Proficiency
- Age, Education, and Employment
- Income and Poverty
- Immigration Pathways and Naturalization
- Unauthorized Immigrant Population
- Health Coverage
- Diaspora
- Top Global Destinations
- Remittances
Size of Immigrant Population over Time
Compared to previous years, the past two decades have seen slower growth of the Vietnamese immigrant population in the United States (see Figure 1). The 26 percent growth rate between 2000 and 2010 was not replicated in subsequent years, falling to 7 percent between 2010 and 2022. For comparison, the total U.S. immigrant population grew by 16 percent between 2010 and 2022.
Figure 1. Vietnamese Immigrant Population in the United States, 1980-2022
Distribution by U.S. State and Key Cities
Immigrants from Vietnam were highly concentrated in California (38 percent), followed distantly by Texas (14 percent) and Washington State (5 percent) in the 2017-21 period. Florida, Virginia, Georgia, and Massachusetts were each home to about 3 percent or 4 percent of the Vietnamese population. The top four counties for Vietnamese immigrants were three in California (Orange, Santa Clara, and Los Angeles counties) and Harris County, Texas. Together these four counties accounted for 31 percent of Vietnamese immigrants in the United States.
Figure 2. Top States of Residence for Vietnamese Immigrants in the United States, 2017-21

Note: Pooled 2017-21 ACS data were used to get statistically valid estimates at the state level for smaller-population geographies. Not shown is the population in Alaska, which is small in size; for details, visit the Migration Policy Institute (MPI) Migration Data Hub for an interactive map showing geographic distribution of immigrants by state and county, available online.
Source: MPI tabulation of data from U.S. Census Bureau pooled 2017-21 ACS.
Click here for an interactive map that highlights the states and counties with the highest concentrations of immigrants from Vietnam and other countries.
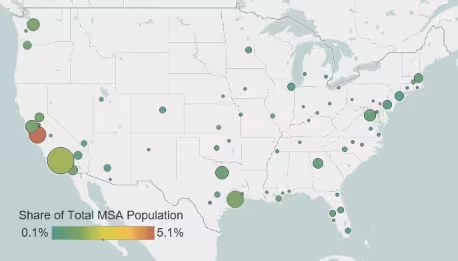
The greater Los Angeles, San Jose, and Houston metropolitan areas were home to 33 percent of Vietnamese immigrants in the United States. More than 5 percent of all residents in the greater San Jose area were born in Vietnam (see Table 1).
Figure 3. Top Metropolitan Destinations for Vietnamese Immigrants in the United States, 2017-21
Note: Pooled 2017-21 ACS data were used to get statistically valid estimates at the metropolitan statistical-area level for smaller-population geographies.
Source: MPI tabulation of data from U.S. Census Bureau pooled 2017-21 ACS.
Click here for an interactive map that highlights the metropolitan areas with the most immigrants from Vietnam and other countries.
Table 1. Top U.S. Metropolitan Areas for Vietnamese Immigrants, 2017-21
|
Metropolitan Area |
Immigrant Population from Vietnam |
% of Metro Area Population |
|---|---|---|
| Los Angeles-Long Beach-Anaheim, CA Metro Area |
244,000 |
1.8% |
| San Jose-Sunnyvale-Santa Clara, CA Metro Area |
102,000 |
5.1% |
| Houston-The Woodlands-Sugar Land, TX Metro Area |
95,000 |
1.3% |
| Dallas-Fort Worth-Arlington, TX Metro Area |
60,000 |
0.8% |
| San Francisco-Oakland-Berkeley, CA Metro Area |
58,000 |
1.2% |
| Seattle-Tacoma-Bellevue, WA Metro Area |
51,000 |
1.3% |
| Washington-Arlington-Alexandria, DC-VA-MD-WV Metro Area |
48,000 |
0.8% |
| Atlanta-Sandy Springs-Alpharetta, GA Metro Area |
36,000 |
0.6% |
| San Diego-Chula Vista-Carlsbad, CA Metro Area |
35,000 |
1.0% |
| Boston-Cambridge-Newton, MA-NH Metro Area |
30,000 |
0.6% |
Source: MPI tabulation of data from the U.S. Census Bureau pooled 2017-21 ACS.
English Proficiency
Vietnamese immigrants are much less likely to be proficient in English than the overall foreign-born population. In 2022, about 64 percent of Vietnamese ages 5 and over reported speaking English less than “very well,” according to the ACS, compared to 46 percent of all immigrants. Approximately 10 percent of Vietnamese immigrants spoke only English at home, versus 17 percent of the overall foreign born.
Age, Education, and Employment
Vietnamese tend to be older than the overall foreign- and U.S.-born populations. The median age for Vietnamese immigrants in 2022 was 53 years old, compared to 47 for all immigrants and 37 for the native born. This is largely due to the disproportionately high number of Vietnamese seniors: 23 percent of Vietnamese were 65 or older, versus 18 percent of the overall foreign-born population and 17 percent for the native born (see Figure 4). Meanwhile, 74 percent of the Vietnamese population was of working age (18 to 64) compared to 58 percent of the U.S. born and 77 percent of all immigrants.
Figure 4. Age Distribution of the U.S. Population by Origin, 2022
Vietnamese adults ages 25 and older tend to have lower educational attainment compared to both the native- and overall foreign-born populations. In 2022, 29 percent of Vietnamese immigrants reported having a bachelor’s degree or higher, compared to 36 percent of the U.S. born and 35 percent of all immigrant adults (see Figure 5). Among Vietnamese who arrived between 2017 and 2021, 28 percent of adults held a college degree, a rate much lower than that of all immigrants who arrived in that period (47 percent).
Click here for data on immigrants’ educational attainment by country of origin and overall.
Figure 5. Educational Attainment of the U.S. Population (ages 25 and older) by Origin, 2022
According to the Institute of International Education, more than 20,700 international students from Vietnam were enrolled in U.S. higher education institutions in the 2021-22 school year, representing the fifth top origin country after China, India, South Korea, and Canada. Vietnamese students accounted for 2 percent of the total 949,000 international students in the United States, and 42 percent of the nearly 49,000 students from Southeast Asia.
Vietnamese participate in the labor force at roughly similar rates as all immigrants. About 65 percent of Vietnamese immigrants and 67 percent of all immigrants ages 16 and over were in the civilian labor force, compared to 62 percent of the native born. Vietnamese were more likely to be employed in service occupations than all immigrants or the U.S. born (see Figure 6).
Figure 6. Employed Workers in the Civilian Labor Force (ages 16 and older) by Occupation and Origin, 2022
Income and Poverty
Vietnamese tend to have higher incomes than the overall foreign- and native-born populations. In 2022, households headed by a Vietnamese immigrant had a median income of $81,000, compared to $75,000 for both all immigrant and U.S.-born households.
In 2022, Vietnamese immigrants were slightly less to be in poverty (11 percent) than the foreign born overall (14 percent) or the U.S. born (12 percent).
Immigration Pathways and Naturalization
Vietnamese are much more likely to be naturalized U.S. citizens than immigrants overall. In 2022, 78 percent of Vietnamese were naturalized citizens, compared to 53 percent of the total foreign-born population.
Compared to all immigrants, Vietnamese are much more likely to have arrived before 2000, with 60 percent doing so. A further 17 percent came between 2000 and 2009, and 23 percent in 2010 or later (see Figure 7).
Figure 7. Immigrants from Vietnam and All Immigrants in the United States by Period of Arrival, 2022
In fiscal year (FY) 2022, Vietnam was the eighth-largest country of origin for new permanent residents. Approximately 24,400 of the 1 million new LPRs (about 2 percent) were from Vietnam. The vast majority of new green-card holders from Vietnam came via family reunification channels: 87 percent received a green card as either immediate relatives of U.S. citizens or were sponsored by other family members. That is higher than the 58 percent of all new LPRs who arrived through those pathways (see Figure 8). About 12 percent of new Vietnamese LPRs came through employment sponsorship.
Figure 8. Immigration Pathways of Vietnamese and All Lawful Permanent Residents in the United States, 2022
The use of family ties to receive LPR status has been greater in recent decades. Until FY 1998, Vietnamese immigrants were more likely to obtain green cards as refugees or asylum seekers. In FY 1982, 99 percent of Vietnamese immigrants receiving green cards had entered on humanitarian grounds (see Figure 9); in FY 2022, less than 1 percent (fewer than 100 individuals) received LPR status through this channel.
Figure 9. Vietnamese Refugee Arrivals to the United States and Select Immigration Pathways of Legal Permanent Residents, FY 1975-2022
Unauthorized Immigrant Population
Although most Vietnamese immigrants in the United States are legally present, approximately 76,000 were unauthorized in 2021, according to Migration Policy Institute (MPI) estimates, comprising less than 1 percent of the overall estimated 11.2 million unauthorized immigrants.
Click here for an overview of the 2021 unauthorized immigrant population in the United States.
As of March 31, 2023, only 40 individuals from Vietnam were participating in the Deferred Action for Childhood Arrivals (DACA) program, out of the total 578,700 DACA recipients. DACA provides temporary deportation relief and work authorization to unauthorized immigrants who arrived as children and meet the program’s education and other eligibility criteria.
Click here to view the top origin countries of origin for DACA recipients and their U.S. states of residence.
Health Coverage
Vietnamese immigrants have high health insurance coverage rates compared to all immigrants. In 2022, just 7 percent of Vietnamese immigrants were uninsured, a rate much lower than the 18 percent of all foreign born who lacked health insurance (see Figure 10).
Figure 10. Health Coverage for Vietnamese Immigrants, All Immigrants, and the U.S. Born, 2022
Diaspora
The Vietnamese diaspora in the United States was comprised of nearly 2.4 million individuals who were either born in Vietnam or reported Vietnamese ancestry or race, according to tabulations from the 2021 ACS. People born in the United States accounted for 43 percent of the overall U.S.-based Vietnamese diaspora. This diaspora represented the 20th largest such group in the United States.
Click here to see estimates of the top 35 diasporas groups in the United States in 2022.
Top Global Destinations
Worldwide, the United States is home to by far the largest number of the 3.4 million Vietnamese residing abroad, according to the most recent, mid-2020 United Nations Population Division estimates. Other top destinations include Japan (336,000), China (303,000), and Australia (270,000).
Click here to view an interactive map showing where migrants from Vietnam and other countries have settled worldwide.
Remittances
Global remittances sent to Vietnam via formal channels have grown more than eight times over since 2000, reaching an estimated $13.2 billion as of 2022, according to the World Bank. Remittances represented more than 3 percent of Vietnam’s gross domestic product (GDP).
Figure 11. Annual Remittance Flows to Vietnam, 2000-22
Click here to view an interactive chart showing annual remittances received and sent to Vietnam and other countries.
Sources
Gibson, Campbell J. and Kay Jung. 2006. Historical Census Statistics on the Foreign-Born Population of the United States: 1850-2000. Working Paper no. 81, U.S. Census Bureau, Washington, DC, February 2006. Available online.
Gordon, Linda W. 1987. Southeast Asian Refugee Migration to the United States. Center for Migration Studies special issues 5 (3): 153-73.
Institute of International Education (IIE). N.d. International Students: All Places of Origin. Accessed September 29, 2023. Available online.
Kelly, Gail P. 1986. Coping with America: Refugees from Vietnam, Cambodia, and Laos in the 1970s and 1980s. Annals of the American Academy of Political and Social Science 487 (1): 138-49.
Knowledge Partnership on Migration and Development (KNOMAD)/World Bank Group. 2023. Remittance Inflows. Updated June 2023. Available online.
Kula, Stacy M. and Susan J. Paik. 2016. A Historical Analysis of Southeast Asian Refugee Communities: Post-War Acculturation and Education in the U.S. Journal of Southeast Asian American Education and Advancement 11 (1): 1. Available online.
Migration Policy Institute (MPI), Migration Data Hub. N.d. Countries of Birth for U.S. Immigrants, 1960-Present. Accessed October 5, 2023. Available online.
---. N.d. Top Diaspora Groups in the United States, 2021. Accessed October 5, 2023. Available online.
Rumbaut, Rubén G. 1996. A Legacy of War: Refugees from Vietnam, Laos, and Cambodia. In Origins and Destinies: Immigration, Race, and Ethnicity in America, eds. Silvia Pedraza and Rubén G. Rumbaut. Belmont, CA: Wadsworth. Available online.
---. 2008. The Coming of the Second Generation: Immigration and Ethnic Mobility in Southern California. The Annals of the American Academy of Political and Social Science 620 (1): 196-236.
UN Population Division. N.d. International Migrant Stock 2020 by Destination and Origin. Accessed October 5, 2023. Available online.
U.S. Census Bureau. 2022. 2021 American Community Survey. Access from Steven Ruggles, Katie Genadek, Ronald Goeken, Josiah Grover, and Matthew Sobek. Integrated Public Use Microdata Series: Version 7.0 [dataset]. Minneapolis: University of Minnesota. Available online.
---. N.d. 2022 American Community Survey—Advanced Search: S0201 Selected Population Profile in the United States. Accessed October 5, 2023. Available online.
U.S. Citizenship and Immigration Services (USCIS). 2023 Count of Active DACA Recipients by Month of Current DACA Expiration as of March 31, 2023. Washington, DC: USCIS. Available online.
U.S. Department of Homeland Security (DHS), Office of Immigration Statistics. 2023. Yearbook of Immigration Statistics 2022. Updated March 3, 2023. Available online.