Speakers of Languages Other than English in the United States
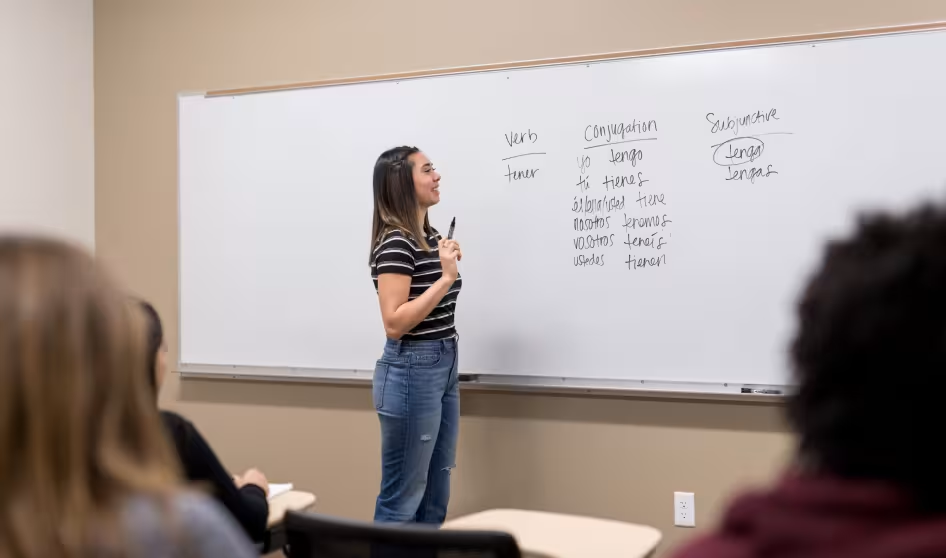
A woman conjugates Spanish verbs at a whiteboard.
Credit: iStock.com/FatCamera
Related Content
Highlights
A record 74.2 million U.S. residents spoke a language other than English at home in 2025, with Spanish by far the most common other language.
- While language diversity has increased, around 92 percent of the U.S. population was proficient in English in 2025; this share has remained broadly stable.
- About 44 percent of people speaking a language other than English at home were U.S. born.
- Residents with limited proficiency in English were more likely to live in poverty and tended to have less education than those who were proficient.
One of the markers and well-documented facilitators of immigrant integration is acquisition of the destination country’s dominant language. In the United States, immigrants and their U.S.-born children who have higher rates of English proficiency tend to have more education, are more likely to work in management and business occupations, and are less likely to live in poverty. The United States had not had an official language until President Donald Trump declared English the official language in a 2025 executive order.1
A record of almost 74.2 million U.S. residents ages 5 and older—including immigrants and people born in the United States—spoke a language other than English at home as of 2025, accounting for close to one-quarter of the overall population ages 5 and older and more than triple the 23.1 million people in 1980 (see Figure 1). Sixty-three percent of people speaking another language at home were also proficient in English. Even as immigration has risen significantly, the share of all U.S. residents who are proficient in English has remained generally steady, hovering around 92 percent. Spanish is by far the most common non-English language, spoken by about three-fifths of individuals who speak another language at home.
Key Statistics
All data are as of 2025
23%
of U.S. residents ages 5 and older spoke a language other than Engish at home
44%
of residents speaking a foreign language were U.S. born
92%
of the U.S. population was proficient in English
Figure 1. U.S. Residents Speaking a Foreign Language at Home, by Proficiency in English, 1980-2025
"Even as immigration has risen significantly, the share of all U.S. residents who are proficient in English has remained generally steady, hovering around 92 percent."
The growing number of U.S. residents speaking languages other than English is not surprising: The immigrant population in the United States nearly quadrupled numerically between 1980 and 2025, to 50.4 million, the lion’s share coming from countries where English is not an official language. Immigrants who do not already speak English learn it in school and in the workplace, while their U.S.-born children grow up with a mix of English and their parents’ languages. About 32.8 million, or 44 percent, of the 74.2 million U.S. residents ages 5 and older who spoke a language other than English at home in 2025 were U.S. born. In addition to immigrant communities, many languages other than English are spoken by Indigenous residents.
This Spotlight provides information on language diversity in the United States and the population of U.S. residents who reported speaking English less than “very well.” Data in this article come from the U.S. Census Bureau’s American Community Survey (ACS) unless otherwise indicated.2
Box 1. Definition
“Foreign born" and "immigrant" are used interchangeably in this article and refer to people with no U.S. citizenship at birth. This population includes naturalized citizens, lawful permanent residents, refugees and asylees, people on certain temporary visas, and unauthorized immigrants.
This article examines languages spoken by both immigrants and the U.S. born, including people born outside the United States to at least one U.S.-citizen parent, who are considered to be U.S. citizens at birth.
Most Common Foreign Languages
Spanish is by far the most common language other than English in the United States. About 61 percent of people speaking another language at home spoke Spanish in 2025, followed distantly by Chinese, Tagalog, and Vietnamese (see Table 1). Most of these individuals also spoke English: Among the most common languages, only Vietnamese speakers were likely to report being able to speak English less than “very well.”
Table 1. U.S. Speakers of Foreign Languages, by Language, 2025
|
Language Spoken at Home |
Total |
Share of All Foreign-Language Speakers (%) |
Share Also Proficient in English (%) |
|---|---|---|---|
| ALL FOREIGN LANGUAGES |
74,191,000 |
100% |
63.1% |
|
Spanish |
44,922,000 |
60.5% |
61.5% |
|
Chinese |
3,776,000 |
5.1% |
51.7% |
|
Tagalog |
1,970,000 |
2.7% |
71.7% |
|
Vietnamese |
1,660,000 |
2.2% |
44.4% |
|
Arabic |
1,366,000 |
1.8% |
68.2% |
|
French |
1,223,000 |
1.6% |
76.9% |
|
Korean |
1,173,000 |
1.6% |
51.3% |
|
Portuguese |
1,038,000 |
1.4% |
67.2% |
|
Hindi |
1,024,000 |
1.4% |
85.2% |
|
Russian |
1,001,000 |
1.3% |
61.8% |
Aside from English, Spanish was the most common language spoken at home in all but four states: Alaska (where Eskimo-Aleut languages were more common), Hawaii (Tagalog), and Maine and Vermont (French). Excluding English and Spanish, the following languages were the most common as of the 2020-24 period (see Figure 2):
- Chinese, in 13 states
- German, in eight states
- French, in six states
- Arabic and Vietnamese, in four states each.
Figure 2. Most Common Languages Other than English and Spanish, by State, 2020-24

Fastest-Growing Foreign Languages
As the origins of U.S. immigrants have diversified, so too have their languages. In the last decade, the number of speakers of languages such as Cebuano (widely spoken in the Philippines), Pashto (spoken in Afghanistan and Pakistan), and Ukrainian more than doubled, while the overall number of foreign-language speakers grew by 17 percent (see Table 2). Only one language, Portuguese, was among both the ten largest and ten fastest-growing languages in 2024. The other languages reflect increasing immigrant communities from origins including Afghanistan, Ukraine, Nepal, and Turkey.
"As the origins of U.S. immigrants have diversified, so too have their languages."
Table 2. Fastest-Growing Foreign Languages in the United States, by Number of Speakers, 2014-24
|
Language |
2014 |
2024 |
Percent Change (2014-24) |
|---|---|---|---|
| Cebuano |
16,000 |
75,000 |
371% |
| Pashto/Afghan |
28,000 |
98,000 |
256% |
| Ukrainian |
156,000 |
351,000 |
125% |
| Kannada |
52,000 |
100,000 |
91% |
| Telugu |
320,000 |
594,000 |
85% |
| Swahili |
116,000 |
215,000 |
85% |
| Nepali |
156,000 |
275,000 |
76% |
| Bengali |
283,000 |
498,000 |
76% |
| Portuguese |
659,000 |
1,114,000 |
69% |
| Turkish |
132,000 |
216,000 |
63% |
People with Limited Proficiency in English
Most U.S. residents who spoke another language at home were also proficient in English; only about 37 percent spoke English less than “very well” as of 2025. These individuals are referred to as limited English proficient (LEP).
This population grew rapidly in the 1990s but was largely stable during the 2010s, at about 25 million. It grew again following the COVID-19 pandemic, reaching 27.4 million in 2025 (or 8 percent of the overall U.S. population ages 5 and older), reflecting significant immigration post-2020.
Box 2. Limited English Proficiency
In the American Community Survey (ACS), respondents ages 5 and older who reported speaking a language other than English at home were asked to self-assess whether they spoke English "not at all," "not well," "well," or "very well."
People who said they spoke English less than “very well” are referred to as limited English proficient (LEP). People with proficiency in English are those who reported speaking English exclusively or "very well."
LEP Population by State and Key Cities
As of 2025, most LEP individuals were in the six traditional immigrant-destination states (see Figure 3). Together, these states accounted for approximately two-thirds of the 27.4 million LEP population:
- California (6.3 million people with limited English proficiency, or 23 percent of the total LEP population),
- Texas (3.6 million, or 13 percent),
- Florida (2.8 million, or 10 percent),
- New York (2.6 million, or 9 percent),
- New Jersey (1.2 million, or 4 percent), and
- Illinois (1.1 million, or 4 percent).
In 11 states, the share of residents who reported limited proficiency in English exceeded the national average. In California, individuals who reported limited English proficiency accounted for 17 percent of the state population—more than twice the national rate—followed by New York (14 percent), and New Jersey and Florida (13 percent apiece).
Figure 3. U.S. Residents with Limited Proficiency in English, by State, 2025
Click here for data on the LEP population by state from 1990-2025
Five metropolitan areas were home to 35 percent of the U.S. LEP population as of the 2020-24 period:
- New York City (12 percent of the total U.S. LEP population),
- Los Angeles (10 percent),
- Miami (5 percent),
- Houston (4 percent), and
- Chicago (4 percent).
People with limited proficiency in English represented more than one-quarter of the total population ages 5 and older in ten metropolitan areas, including seven in Texas. The metropolitan areas with the highest shares of LEP residents included:
- Laredo, Texas (where LEP residents accounted for 39 percent of the total local population, or 97,000 individuals);
- Rio Grande City-Roma, Texas (38 percent, or 23,000);
- Eagle Pass, Texas (37 percent, or 20,000);
- Nogales, Arizona (35 percent, or 16,000); and
- El Centro, California (34 percent, or 57,000).
English Proficiency among Immigrants and the U.S. Born
Although most people with limited proficiency in English in 2025 were foreign born, 19 percent (5.1 million) were born in the United States (see Figure 4).
Figure 4. U.S. Residents (ages 5 and older) with Limited Proficiency in English, by Nativity, 1990-2025
In 2025, about 44 percent of all immigrants ages 5 and older (close to 22.3 million) were LEP, compared to 2 percent of the U.S. born (see Table 3).
Table 3. U.S. Residents (ages 5 and older) with Limited Proficiency in English, by Nativity, 2025
|
Total |
Limited Proficiency in English |
LEP Share of Nativity Group (%) |
Nativity Group Share of All LEP Individuals (%) |
|
|---|---|---|---|---|
| ALL RESIDENTS (ages 5 and over) |
323,581,000 |
27,372,000 |
8.5% |
100.0% |
|
U.S. Born |
273,548,000 |
5,121,000 |
1.9% |
18.7% |
|
Immigrant |
50,033,000 |
22,251,000 |
44.5% |
81.3% |
Among immigrants, 31 percent of LEP residents as of 2024 were born in Mexico, followed by China/Hong Kong (6 percent), Cuba (5 percent), and El Salvador, Guatemala, and Vietnam (4 percent each). The Dominican Republic, Honduras, Colombia, and India were each the birthplace of about 3 percent of the LEP immigrant population.
LEP immigrants were less likely than those with proficiency in English to be naturalized U.S. citizens: 40 percent versus 62 percent, respectively.
Among LEP individuals who were U.S. citizens at birth, 12 percent were born in Puerto Rico and about 5 percent were born in another country to at least one U.S.-citizen parent (Mexico was the most common birth country). In the 50 U.S. states, the most common birthplaces for LEP residents were:
- California (19 percent),
- Texas (15 percent), and
- New York (10 percent).
Language Diversity among the LEP Population
Spanish is the predominant language spoken by both immigrant and U.S.-born LEP individuals. About 64 percent of the LEP population (or 18.4 million people) spoke Spanish, followed by Chinese (7 percent, or 1.9 million), Vietnamese (3 percent, or 918,000), Tagalog (2 percent, or 600,000), and Korean (2 percent, or 555,000) as of 2024. About 77 percent of the LEP population spoke one of these five languages.
There were some differences, however, in the top languages spoken by LEP immigrants and the native born. Of the U.S. born who had limited proficiency in English, 75 percent (or 4 million) spoke Spanish, followed by Chinese (3 percent, or 168,000), Yiddish (2 percent, or 117,000), and Vietnamese (2 percent, or 85,000). Among immigrant LEP individuals, Spanish was also the top language, spoken by about 61 percent (or 14.3 million), followed by Chinese (7 percent, or 1.7 million), Vietnamese (4 percent, or 833,000), and Tagalog (2 percent, or 559,000; see Figure 5).
Figure 5. Top Languages of LEP U.S. Residents, by Nativity, 2024
The linguistic diversity of the LEP population varies across the nation due to differing immigration trends and population composition. For instance, in 2024, the top languages spoken by LEP residents of New York State were Spanish, Chinese, and Yiddish, while the most common in Maine were Spanish, French, and Chinese, and the most common in Hawaii were Tagalog, Illocano, and Chinese.
In addition, speakers of some languages are much more likely to have limited proficiency in English than others, even among people with relatively similar backgrounds. Seventy-three percent of people who spoke Karen at home had limited proficiency in English, a higher share than any other language and higher than the 58 percent of Chin speakers and 59 percent of Burmese speakers (all three languages are spoken by people in Southeast Asia).
Who Are LEP Residents? Age, Ethnicity, Education, Employment, and Poverty
Compared to their English-proficient counterparts, LEP individuals were much more likely to be of working age (18 to 64; see Figure 6). In 2024, about 10 percent of LEP individuals were children between the ages 5 and 17, versus 18 percent of the English-proficient population. Seventy-one percent were between ages 18 and 64 compared to 63 percent of English-proficient individuals.
Figure 6. Age Distribution of the U.S. Population, by English Proficiency, 2024
In terms of ethnic and racial background, LEP individuals are especially likely to be Latino or Asian (see Figure 7). Latinos comprised 62 percent of the LEP population in 2024, compared to 15 percent of the English-proficient population. Likewise, 22 percent of LEP individuals were Asian or Pacific Islander, compared to 6 percent of those who were proficient in English.
Figure 7. Race and Ethnicity of the U.S. Population, by English Proficiency, 2024
Education, Employment, and Poverty
In general, LEP adults had relatively low levels of education. In 2024, 38 percent of LEP individuals ages 25 and older lacked a high school diploma, compared to 7 percent of those who were proficient in English. About 20 percent of LEP adults had a bachelor’s degree or higher, compared to 39 percent of English-proficient adults.
LEP individuals ages 16 and older participated in the civilian labor force at a slightly lower rate than the English proficient (62 percent versus 64 percent), largely because of greater gender differences in employment. Among those with proficiency in English, 68 percent of men and 60 percent of women participated in the civilian labor force; the gender gap was much larger for LEP individuals: 73 percent for men versus 52 percent for women.
LEP men were more likely to work in natural resources, construction, and maintenance occupations than their English-proficient counterparts (29 percent versus 13 percent), while LEP women were significantly more likely to work in service occupations (40 percent versus 18 percent; see Figure 8).
Figure 8. Employed Workers in the Civilian Labor Force (ages 16 and Older), by Occupation, English Proficiency, and Gender, 2024
LEP individuals were more likely to live in poverty than others. In 2024, about 17 percent of residents with limited proficiency in English lived in households with annual incomes below the federal poverty line, compared to 10 percent of the English proficient. (The U.S. Census Bureau defined poverty as having an income below $32,100 for a family of four in 2024.3)
Sources
Batalova, Jeanne and Michael Fix. 2021. Leaving Money on the Table: The Persistence of Brain Waste among College-Educated Immigrants. Washington, DC: Migration Policy Institute (MPI).
Heller, Blake H. and Kirsten Slungaard Mumma. 2023. Immigrant Integration in the United States: The Role of Adult English Language Training. American Economic Journal: Economic Policy 15 (3): 407-37.
McHugh, Margie et al. 2025. All in for a Thriving Connecticut: Opportunities to Support Upward Mobility for the State’s Immigrant Families. Washington, DC: MPI.
U.S. Census Bureau. 2025. Income, Poverty, and Health Insurance Coverage in the United States: 2024. Press release, September 9, 2025.
---. 2026. 1990, 2000 Decennial Census and 2019-2024 American Community Survey. Accessed from Steven Ruggles, Sarah Flood, Matthew Sobek, Daniel Backman, Grace Cooper, Julia A. Rivera Drew, Stephanie Richards, Renae Rodgers, Jonathan Schroeder, and Kari C.W. Williams. IPUMS USA: Version 16.0 [dataset]. Minneapolis, MN: IPUMS.
---. N.d. 2025 American Community Survey — Advanced Search: B16001: Language Spoken at Home by Ability to Speak English for the Population 5 Years and Over. Accessed November 2, 2026.
---. N.d. 2025 American Community Survey — Advanced Search: B16005: Nativity by Language Spoken at Home by Ability to Speak English for the Population 5 Years and Over. Accessed November 2, 2026.
White House. 2025. Designating English as the Official Language of the United States. March 1, 2025.
Notes
-
1
The White House, “Designating English as the Official Language of the United States,” March 1, 2025.
-
2
U.S. Census Bureau, "B16005: Nativity by Language Spoken at Home by Ability to Speak English for the Population 5 Years and Over” and “B16001: Language Spoken at Home by Ability to Speak English for the Population 5 Years and Over,” accessed November 2, 2026.
-
3
U.S. Census Bureau, “Income, Poverty, and Health Insurance Coverage in the United States: 2024,” press release, September 9, 2025.

Related Content