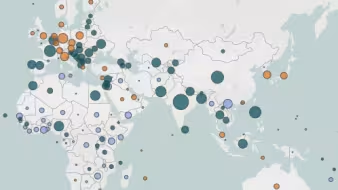
Annual Remittance Flows by Country, 1980-2024
This time series chart shows annual remittance inflows and outflows by country from 1980 to present in current U.S. dollars, as well as remittances as a share of a country’s total Gross Domestic Product (GDP). Multiple countries can be selected using the search bar.
Note
All numbers are in current (nominal) U.S. dollars. This means that dollar values are not constant between years, e.g. a 1980 dollar may have greater purchasing power than a 2024 dollar.
Sources
1. Migration Policy Institute (MPI) tabulations of remittance inflow and outflow data from the Dilip Ratha, Sonia Plaza, and Eung Ju Kim, “In 2024, Remittance Flows to Low- and Middle-Income Countries Are Expected to Reach $685 Billion, Larger than FDI and ODA Combined,” World Bank blog, December 18, 2024.
2. Gross domestic product estimates are from MPI tabulations of data from the World Bank's World Development Indicators, “GDP (current U.S. $),” July 2026 update.