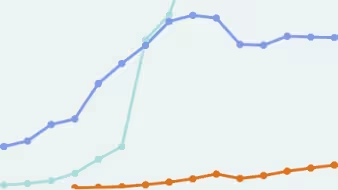
Annual Remittance Inflows and Outflows, 1980-Present

This map displays total remittance inflows and outflows by country since 1980. Remittance volume is displayed either by current U.S. dollar (USD) value or as a share of total gross domestic product (GDP). Countries are colored according to whether they send more remittances than they receive or they receive more than they send.
Notes
All numbers are in current (nominal) U.S. dollars. This means that dollar values are not constant between years; for example, a 1980 dollar may have greater purchasing power than a 2023 dollar.
Sources
Migration Policy Institute tabulations of remittance inflow and outflow data from the World Bank Global Knowledge Partnership on Migration and Development (KNOMAD) (June 2024 update). Available here: www.knomad.org/data/remittances.
Gross domestic product estimates are from Migration Policy Institute tabulations of World Bank World Development Indicators data. GDP (current U.S. $) (July 2024 update). Available here: http://data.worldbank.org/indicator/NY.GDP.MKTP.CD.