

A woman makes arepas in the kitchen. (Photo: iStock.com/Amfer75)
Haga clic aquí para leer este artículo en español.
Reflecting a deep economic and political crisis under the authoritarian rule of President Nicolás Maduro, Venezuela remains one of the globe’s largest origins of migrants. Of the roughly 7.9 million Venezuelan refugees and migrants worldwide as of December 2024, a total of 85 percent—6.7 million—resided in Latin America and the Caribbean. The United States emerged as a significant destination only in the last decade or so. As of 2023, approximately 770,000 Venezuelan immigrants lived in the United States, accounting for slightly less than 2 percent of all 47.8 million immigrants in the country.
The economic and political instability that has driven Venezuelans abroad since 2015 was further accentuated by the COVID-19 pandemic. As more Venezuelans left their country, the prospects of economic opportunity and a growing diaspora in the United States led an increasing number to try and reach the United States. Some emigrated from Venezuela directly, while many others arrived after prior residence in other Latin American countries. Many U.S.-bound Venezuelan migrants took dangerous routes to reach the country, including transiting the treacherous Darien Gap and Central America.
The number of U.S. Customs and Border Protection (CBP) encounters of Venezuelan migrants at the U.S.-Mexico border grew rapidly from 49,000 in fiscal year (FY) 2021 to 188,000 the following year and 266,000 in FY 2023. Encounters slowed over the course of FY 2024 and fell slightly to 261,000, following increased enforcement by authorities in Panama and Mexico, as well as new asylum restrictions imposed by the Biden administration. The administration developed a carrot-and-stick approach aimed at combining legal temporary pathways and statuses for Venezuelans (and migrants from other troubled countries) with restrictions on access to asylum for crossing the border irregularly.
The Biden administration designated Venezuela for Temporary Protected Status (TPS) in 2021, allowing significant numbers of Venezuelans already in the United States to receive work authorization and protection from deportation; it expanded eligibility in 2023. As of January 2025, approximately 607,000 Venezuelan nationals were estimated to be covered by TPS. Together with Cubans, Haitians, and Nicaraguans, Venezuelans with a U.S.-based sponsor could also participate in a special humanitarian parole program (known as CHNV) to legally enter the United States (paying for their own air travel to the United States). More than 117,000 Venezuelans obtained parole under this program between January 2023 and December 2024. At the same time, beginning in mid-2024, Venezuelans and other migrants crossing the border irregularly became generally ineligible for asylum.
The return of the Trump administration in January 2025 brought several profound changes to U.S. immigration policy, and specifically for Venezuelans. On his first day in office, President Donald Trump ended the CHNV program for new arrivals, and subsequently allowed discretion for authorities to quickly deport some parolees already in the United States. The new administration also cancelled the Biden administration’s last-minute extension of Venezuelans’ TPS, meaning the protections are set to expire in two stages later in 2025.
Venezuelan immigrants in the United States are particularly concentrated in Florida, mostly arrived since 2010, and tend to have higher levels of education than immigrants overall. Venezuelans also are less likely to be U.S. citizens, are less likely to be proficient in English, and typically earn lower incomes than other immigrants.
This Spotlight provides information on the Venezuelan immigrant population in the United States, focusing on its size, geographic distribution, and socioeconomic characteristics.
Click on the bullet points below for more information:
Size of Immigrant Population over Time
In 1980, the number of Venezuelan immigrants in the United States was about 33,000. The population more than tripled by 2000 (see Figure 1). Since 2010, Venezuelans have been among the fastest-growing U.S. immigrant groups, with the population growing 318 percent between 2010 and 2023, compared to 20 percent for the overall immigrant population.
Figure 1. Immigrant Population from Venezuela in the United States, 1980-2023
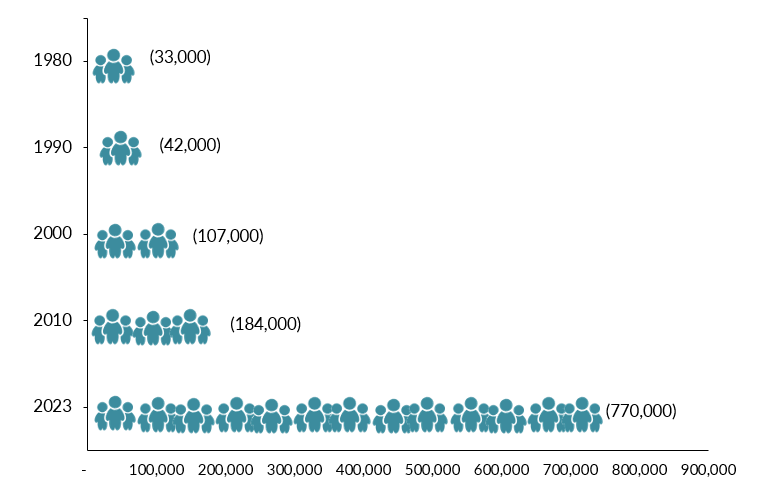
Source: Data from U.S. Census Bureau’s 2010 and 2023 American Community Surveys (ACS), and Campbell J. Gibson and Kay Jung, "Historical Census Statistics on the Foreign-Born Population of the United States: 1850-2000" (Working Paper no. 81, U.S. Census Bureau, Washington, DC, February 2006), available online.
Distribution by State and Key Cities
Forty-nine percent of Venezuelan immigrants resided in Florida in the 2019-23 period, making it by far the most popular state of residence. The states with the next largest numbers of Venezuelans were Texas (14 percent), Georgia and New York (4 percent apiece), and California (3 percent). Combined, these five states were home to 74 percent of Venezuelan immigrants. The top four counties by concentration were three counties in Florida—Miami-Dade, Broward, and Orange counties—and Harris County, Texas. Together, these four counties were home to 38 percent of the Venezuelan-born population in the United States.
Figure 2. Top States of Residence for Venezuelan Immigrants in the United States, 2019-23

Notes: Pooled 2019–23 ACS data were used to get statistically valid estimates at the state level for smaller-population geographies. Not shown is the population in Alaska, which is small in size. For details, visit the Migration Policy Institute’s (MPI) Migration Data Hub for an interactive map showing the geographic distribution of immigrants by state and county, available online.
Source: MPI tabulation of data from the U.S. Census Bureau's pooled 2019-23 ACS.
Click here for an interactive map that highlights the states and counties with the highest concentrations of immigrants from Venezuela or other countries.
As of the 2019-23 period, the greater Miami, Orlando, and Houston metropolitan areas were home to 48 percent of all Venezuelan immigrants in the country. Venezuelan immigrants represented close to 3 percent of the total population of the greater Miami area (see Table 1).
Figure 3. Top Metropolitan Destinations for Venezuelan Immigrants in the United States, 2019-23
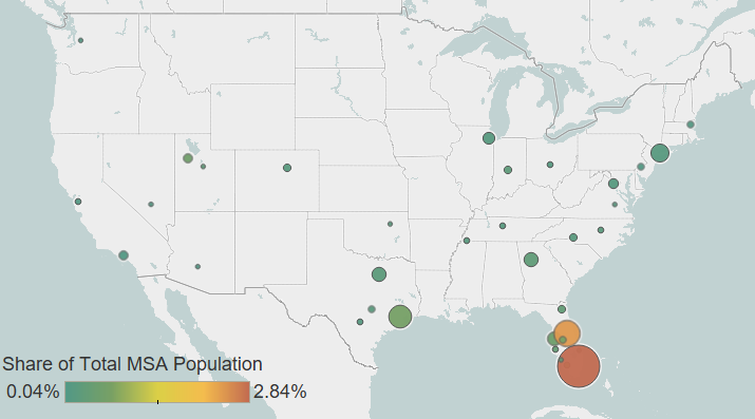
Notes: Pooled 2019–23 ACS data were used to get statistically valid estimates at the metropolitan statistical-area level for smaller-population geographies. Not shown are the populations in Alaska or Hawaii, which are small in size. For details, visit MPI’s Migration Data Hub for an interactive map showing geographic distribution of immigrants by metro area, available online.
Source: MPI tabulation of data from U.S. Census Bureau pooled 2019–23 ACS.
Click here for an interactive map that highlights the metro areas with the most immigrants from Venezuela or other countries.
Table 1. Top U.S. Metropolitan Areas of Residence for Venezuelan Immigrants, 2019-23
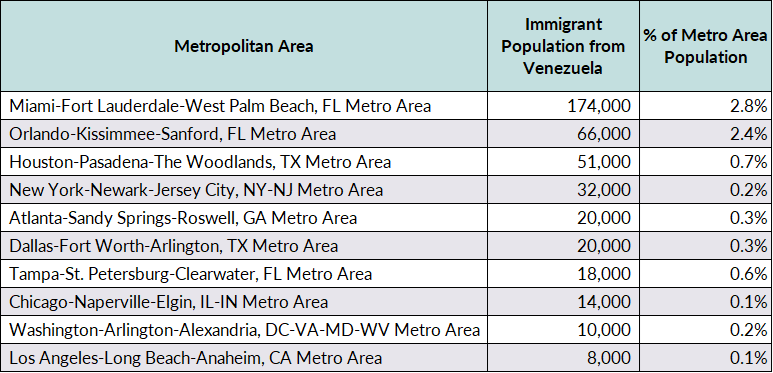
Source: MPI tabulation of data from the U.S. Census Bureau pooled 2019-23 ACS.
Venezuelan immigrants are less likely to be proficient in English than the overall foreign-born population. In 2023, 59 percent of Venezuelan immigrants ages 5 and over reported speaking English less than “very well,” compared to 47 percent of all immigrants. Approximately 6 percent of Venezuelan immigrants spoke only English at home, versus 17 percent of all immigrants.
Age, Education, and Employment
Venezuelan immigrants tend to be younger than the overall foreign-born population but slightly older than the U.S. born. Their median age in 2023 was about 39, compared to 47 for all immigrants and 37 for the native born. Like immigrants overall, Venezuelans are more likely than the native born to be of working age (18 to 64 years old; see Figure 4).
Figure 4. Age Distribution of the U.S. Population, by Origin, 2023
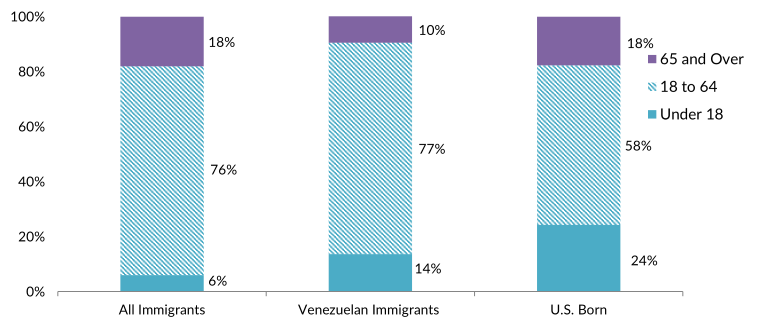
Note: Percentages may not add up to 100 as they are rounded to the nearest whole number.
Source: MPI tabulation of data from the U.S. Census Bureau’s 2023 ACS.
Venezuelan adults have higher rates of educational attainment than either the native- or overall foreign-born populations. In 2023, approximately 48 percent of Venezuelan immigrants ages 25 and older reported having a bachelor’s degree or higher, compared to 36 percent of U.S.-born and 35 percent of immigrant adults (see Figure 5).
Figure 5. Educational Attainment of the U.S. Population (ages 25 and older), by Origin, 2023
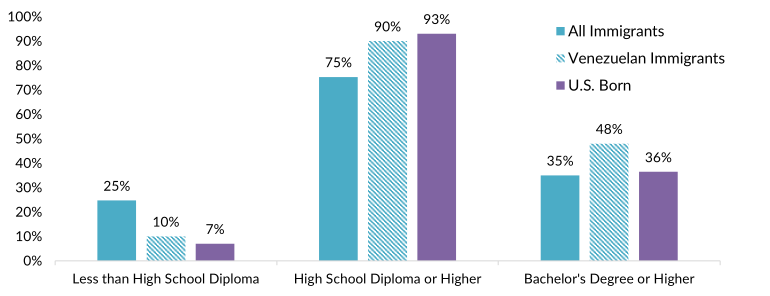
Note: Percentages may not add up to 100 as they are rounded to the nearest whole number.
Source: MPI tabulation of data from the U.S. Census Bureau 2023 ACS.
Click here for data on immigrants’ educational attainment by country of origin and overall.
About 3,900 international students from Venezuela were enrolled in U.S. higher education institutions in the 2023-24 school year, according to the Institute of International Education, comprising a relatively small share of the total 1.1 million international students in the United States. Following Brazil, Mexico, Colombia, and Peru, Venezuela was the fifth largest country of origin from Latin America and the Caribbean, representing approximately 5 percent of the 85,900 students from the region enrolled in the United States.
Venezuelans participate in the labor force at much higher rates than the overall foreign-born and native-born populations. About 75 percent of Venezuelan immigrants ages 16 and older were in the civilian labor force in 2023, compared to 67 percent of the overall foreign-born population and 63 percent the U.S. born. Venezuelans were more likely to be employed in production, transportation, and material moving occupations than workers of other origins (see Figure 6).
Figure 6. Employed Workers in the Civilian Labor Force (ages 16 and older), by Occupation and Origin, 2023
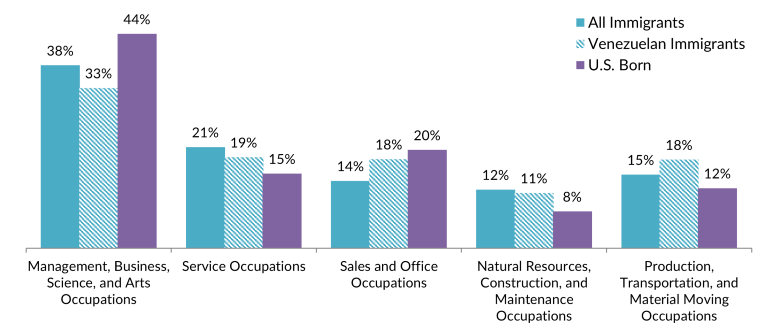
Note: Percentages may not add up to 100 as they are rounded to the nearest whole number.
Source: MPI tabulation of data from the U.S. Census Bureau’s 2023 ACS.
On average, Venezuelans have lower incomes than the overall foreign- and native-born populations. Households headed by a Venezuelan immigrant had a median annual income of $71,900 in 2023, compared to $78,700 for all immigrant-led households and $77,600 for those led by the U.S. born.
In 2023, Venezuelan immigrants were more likely to be in poverty (17 percent) than immigrants overall (14 percent) or the U.S. born (12 percent).
Immigration Pathways and Naturalization
Venezuelans are less likely to be naturalized U.S. citizens than immigrants overall. In 2023, 25 percent of Venezuelan immigrants were U.S. citizens, compared to 52 percent of the total foreign-born population.
Compared to all immigrants, Venezuelans are more likely to have arrived in the United States recently: 74 percent arrived since 2010, compared to 35 percent of all immigrants. Just 14 percent of Venezuelans arrived before 2000 (see Figure 7).
Figure 7. Venezuelan and All Immigrants in the United States, by Period of Arrival, 2023

Note: Percentages may not add up to 100 as they are rounded to the nearest whole number.
Source: MPI tabulation of data from the U.S. Census Bureau’s 2023 ACS.
In FY 2023, Venezuela was the 14th largest country of origin for new U.S. lawful permanent residents (LPRs, also known as green-card holders). Approximately 18,400 Venezuelans received a green card that year, representing 2 percent of all 1.2 million new green-card holders. Of the Venezuelans receiving a green card in FY 2023, 26 percent did so after being resettled as a refugee or receiving asylum, a much higher share than the 8 percent of all new LPRs (see Figure 8).
Figure 8. Immigration Pathways of Venezuelan and All Lawful Permanent Residents in the United States, FY 2023
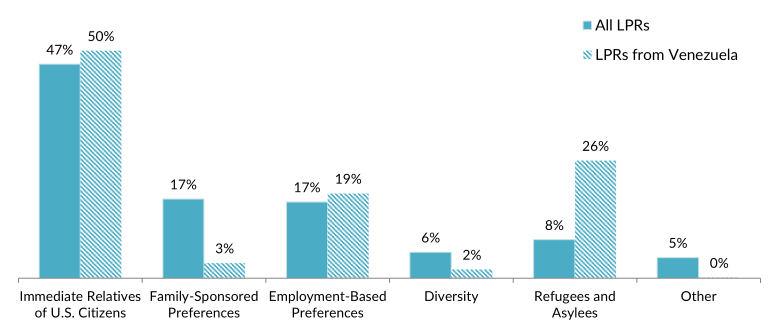
Notes: Immediate Relatives of U.S. Citizens: Includes spouses, minor children, and parents of U.S. citizens. Family-Sponsored Preferences: Includes adult children and siblings of U.S. citizens as well as spouses and children of green-card holders. The Diversity Visa lottery was established by the Immigration Act of 1990 to allow entry to immigrants from countries with low rates of immigration to the United States. The law states that 55,000 diversity visas in total are made available each fiscal year. Individuals born in Venezuela were not eligible for the 2026 lottery. Percentages may not add up to 100 as they are rounded to the nearest whole number.
Source: MPI tabulation of data from U.S. Department of Homeland Security (DHS), Office of Homeland Security Statistics (OHSS), “Table 10: Persons Obtaining Lawful Permanent Resident Status by Broad Class of Admission and Region and Country of Birth: Fiscal Year 2023,” updated September 16, 2024, available online.
Unauthorized Immigrant Population
Approximately 486,000 Venezuelans were unauthorized as of mid-2023, according to Migration Policy Institute (MPI) estimates. Venezuela ranked as the fifth largest origin country for unauthorized immigrants in the United States, accounting for 4 percent of all 13.7 million unauthorized immigrants.
Click here for an MPI overview of the unauthorized immigrant population in the United States as of mid-2023.
As of September 2024, 1,610 immigrants from Venezuela participated in the Deferred Action for Childhood Arrivals (DACA) program, accounting for less than 1 percent of the 537,730 active DACA participants. DACA provides temporary deportation relief and work authorization to unauthorized immigrants who arrived as children and meet education and other eligibility criteria.
Click here to view the top origin countries of DACA recipients and their U.S. states of residence.
Approximately 607,000 Venezuelans living in the United States as of January 2025 were estimated to be covered by TPS, which grants work authorization and protection from deportation. Also, more than 117,000 had arrived and secured humanitarian parole under the CHNV program before it was halted in December 2024.
Venezuelans are less likely to be covered by public health insurance than all immigrants or the U.S. born. They are also more likely to be covered by private health insurance than the total immigrant population. Similar to immigrants overall, Venezuelans were more likely to be uninsured (18 and 19 percent, respectively) than the U.S. born (6 percent; see Figure 9).
Figure 9. Health Coverage for Venezuelan Immigrants, All Immigrants, and the U.S. Born, 2023
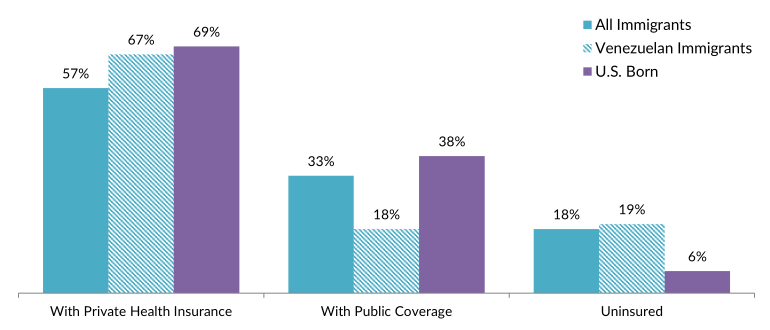
Note: The sum of shares by type of insurance is likely to be greater than 100 because people may have more than one type of insurance.
Source: MPI tabulation of data from the U.S. Census Bureau’s 2023 ACS.
The Venezuelan diaspora in the United States is comprised of more than 1 million individuals who were either born in Venezuela or reported Venezuelan ancestry or origin, according to an MPI tabulation of data from the U.S. Census Bureau’s 2023 American Community Survey (ACS).
Click here to see estimates of the largest diaspora groups in the United States in 2023.
Globally, the top destinations for Venezuelan refugees and migrants abroad as of December 2024 were Colombia (2.8 million) and Peru (1.7 million), according to the Regional Interagency Coordination Platform for Refugees and Migrants of Venezuela (R4V). Other countries with significant populations were Brazil (630,000), Chile (533,000), and Ecuador (445,000).
Sources
Gibson, Campbell J. and Kay Jung. 2006. Historical Census Statistics on the Foreign-Born Population of the United States: 1850-2000. Working Paper no. 81, U.S. Census Bureau, Washington, DC, February 2006. Available online.
Institute of International Education (IIE). N.d. International Students: All Places of Origin. Accessed January 29, 2025. Available online.
Kinosian, Sarah and Vivian Sequera. 2022. Explainer: Why Venezuela’s Refugee Exodus to the U.S. Has Been Accelerating. Reuters, October 19, 2022. Available online.
Migration Policy Institute (MPI), Migration Data Hub. 2025. Deferred Action for Childhood Arrivals (DACA) Data Tools. Accessed January 29, 2025. Available online.
National Public Radio (NPR) Staff. 2025. All the Executive Orders Trump Has Signed after 1 Week in Office. NPR, January 28, 2025. Available online.
Regional Interagency Coordination Platform for Refugees and Migrants of Venezuela (R4V). 2024. R4V Latin America and the Caribbean, Venezuelan Refugees and Migrants in the Region - Nov 2024. N.p.: R4V. Available online.
U.S. Census Bureau. 2024. 2023 American Community Survey. Access from Steven Ruggles, Sarah Flood, Matthew Sobek, Daniel Backman, Annie Chen, Grace Cooper, Stephanie Richards, Renae Rodgers, and Megan Schouweiler. IPUMS USA: Version 15.0 [dataset]. Minneapolis, MN: IPUMS, 2024. Available online.
---. N.d. 2023 American Community Survey—Advanced Search: S0201 Selected Population Profile in the United States. Accessed January 10, 2025. Available online.
U.S. Citizenship and Immigration Services (USCIS). 2024. Count of Active DACA Recipients by Month of Current DACA Expiration as of September 30, 2024. Updated September 30, 2024. Available online.
---. 2025. Extension of the 2023 Designation of Venezuela for Temporary Protected Status. Federal Register 90, no. 11 (January 17, 2025): 5961-72. Available online.
U.S. Customs and Border Protection (CBP). 2025. CBP Releases December 2024 Monthly Update. Press release, January 14, 2025. Available online.
---. 2025. Nationwide Encounters. Updated January 20, 2025. Available online.
U.S. Department of Homeland Security (DHS), Office of Homeland Security Statistics (OHSS). 2024. 2023 Yearbook of Immigration Statistics. Washington, DC: DHS OHSS. Available online.
U.S. State Department, Bureau of Consular Affairs. N.d. Instructions for the 2026 Diversity Immigrant Visa Program (DV-2026). Washington, DC: State Department Bureau of Consular Affairs. Available online.
Van Hook, Jennifer, Ariel G. Ruiz Soto, and Julia Gelatt. 2025. The Unauthorized Immigrant Population Expands amid Record U.S.-Mexico Border Arrivals. MPI short read, February 2025. Available online.
Wilson, Jill H. 2024. Temporary Protected Status and Deferred Enforced Departure. Washington, DC: Congressional Research Service (CRS). Available online.