


A crowd at a Dominican Day parade in New York City. (Photo: Ryan Rahman/iStock.com)
Haga clic aquí para leer este artículo en español.
While immigrants from the Dominican Republic represent just 3 percent of the 46.2 million immigrants in the United States, this population is increasing significantly faster than the overall U.S. foreign-born population—growing 46 percent since 2010, as compared to 16 percent for all immigrants.
The 1.3 million Dominican immigrants in the United States represent the second-largest Caribbean foreign-born group after Cubans, and the fourth-largest Latino immigrant group after Mexicans, Salvadorans, and Cubans.
Dominican immigration to the United States was limited until the second half of the 20th century. Dictator Rafael Trujillo placed high restrictions on emigration and Dominicans’ access to visas. The political unrest and economic fallout that followed Trujillo’s assassination in 1961, and especially the U.S. military intervention in 1965, led to mass emigration among urban professionals and the middle class. Just 12,000 Dominicans lived in the United States in 1960, but the number had risen to 169,000 two decades later.
The next significant period of arrival of Dominicans began in 1980. A series of economic crises and reduced sugar exports led to worsening conditions for many Dominicans on Hispaniola, the island shared with Haiti. Between 1980 and 2000, the size of the U.S. Dominican population grew by more than 500,000, with the 1965 Immigration and Nationality Act’s prioritization of family reunification opening the door. To this day, almost all Dominicans obtaining permanent residence in the United States do so through family ties.
Historically, most Dominicans have settled in New York City, in neighborhoods such as Manhattan’s Washington Heights. Close to 55 percent of all Dominican immigrants in the United States lived in the greater New York metropolitan area as of the 2018-22 period, making them the second-most geographically concentrated Latino immigrant group, behind Cubans (59 percent of whom lived in the greater Miami area).
This Spotlight provides information on the Dominican immigrant population in the United States, focusing on its size, geographic distribution, and socioeconomic characteristics.
Click on the bullet points below for more information:
Size of Immigrant Population over Time
The Dominican immigrant population has grown at different speeds over time. It increased by 46 percent (or 401,000 new immigrants) between 2010 and 2022, 28 percent during the 2000-10 period, and roughly doubled in both the 1990s and 1980s (see Figure 1).
Figure 1. Immigrant Population from the Dominican Republic in the United States, 1980-2022

Source: Data from U.S. Census Bureau 2010 and 2022 American Community Surveys (ACS), and Campbell J. Gibson and Kay Jung, "Historical Census Statistics on the Foreign-Born Population of the United States: 1850-2000" (Working Paper no. 81, U.S. Census Bureau, Washington, DC, February 2006), available online.
Distribution by State and Key Cities
Immigrants from the Dominican Republic were concentrated in New York (41 percent), New Jersey (17 percent), Florida (11 percent), and Massachusetts (8 percent) as of the 2018-22 period. The top three counties—home to 29 percent of all immigrants from the Dominican Republic—were in New York: Bronx, New York, and Queens counties.
Figure 2. Top States of Residence for Dominican Immigrants in the United States, 2018-22
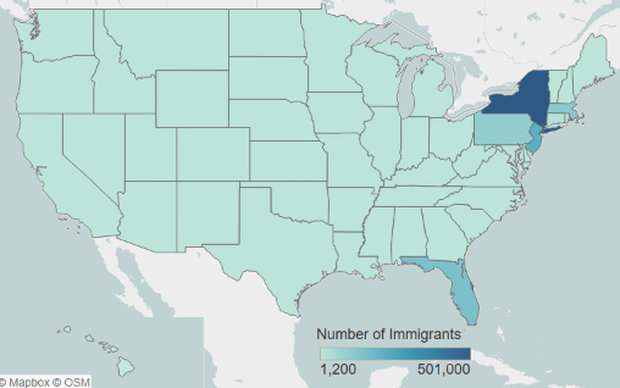
Notes: Pooled 2018–22 ACS data were used to get statistically valid estimates at the state level for smaller-population geographies. Not shown is the population in Alaska, which is small in size. For details, visit the Migration Policy Institute (MPI) Migration Data Hub for an interactive map showing the geographic distribution of immigrants by state and county, available online.
Source: MPI tabulation of data from the U.S. Census Bureau's pooled 2018-22 ACS.
Click here for an interactive map that highlights the states and counties with the highest concentrations of immigrants from the Dominican Republic or another country.
About 68 percent of all immigrants from the Dominican Republic lived in the greater New York (55 percent), Boston (7 percent), or Miami (6 percent) metropolitan areas.
Figure 3. Top Metropolitan Destinations for Dominican Immigrants in the United States, 2018-22

Notes: Pooled 2018–22 ACS data were used to get statistically valid estimates at the metropolitan statistical-area level for smaller-population geographies. Not shown are the populations in Alaska or Hawaii, which are small in size. For details, visit MPI’s Migration Data Hub for an interactive map showing geographic distribution of immigrants by metro area, available online.
Source: MPI tabulation of data from U.S. Census Bureau pooled 2018–22 ACS.
Click here for an interactive map that highlights the metro areas with the most immigrants from the Dominican Republic or another country.
Table 1. Top U.S. Metropolitan Areas of Residence for Dominican Immigrants, 2018-22
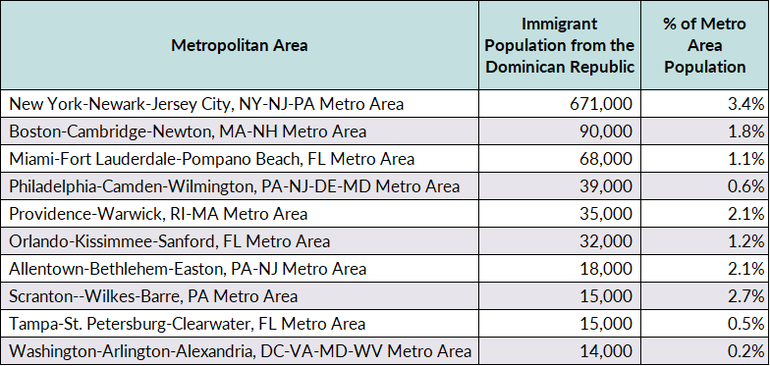
Source: MPI tabulation of data from the U.S. Census Bureau pooled 2018-22 ACS.
Dominican immigrants are less likely to be proficient in English than the overall U.S. foreign-born population. In 2022, about 64 percent of Dominicans ages 5 and over reported speaking English less than “very well,” compared to 46 percent of all immigrants. Approximately 5 percent of Dominicans spoke only English at home, compared to 17 percent of the total foreign-born population.
Age, Gender, Education, and Employment
The age distribution of Dominican immigrants is roughly similar to that of the total foreign-born population, with 75 percent between ages 18 and 64 in 2022 (compared to 77 percent of all immigrants; see Figure 4). The median age of Dominican immigrants in 2022 was 46 years, compared to 47 years for all immigrants and 37 years for the native born.
Figure 4. Age Distribution of the U.S. Population, by Origin, 2022
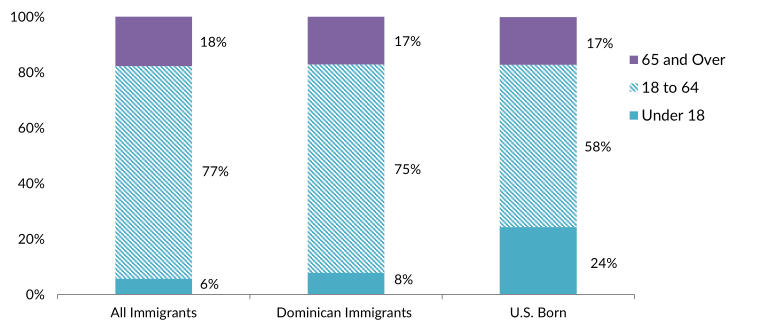
Note: Percentages may not add up to 100 as they are rounded to the nearest whole number.
Source: MPI tabulation of data from the U.S. Census Bureau 2022 ACS.
Historically, immigrants from the Dominican Republic have been more likely to be women. In 2022, 55 percent of all Dominican-born immigrants were women and girls, compared to 51 percent of all immigrants and 50 percent of the U.S. born.
Overall, Dominican immigrants tend to have lower educational attainment than both U.S.-born and all immigrant adults. In 2022, 18 percent of Dominican immigrants ages 25 and older reported having at least a bachelor’s degree, compared to 36 percent of the U.S. born and 35 percent of foreign-born adults (see Figure 5). About 30 percent of Dominican adults lacked a high school diploma, compared to 25 percent of all immigrant adults.
Figure 5. Educational Attainment of the U.S. Population (ages 25 and older), by Origin, 2022
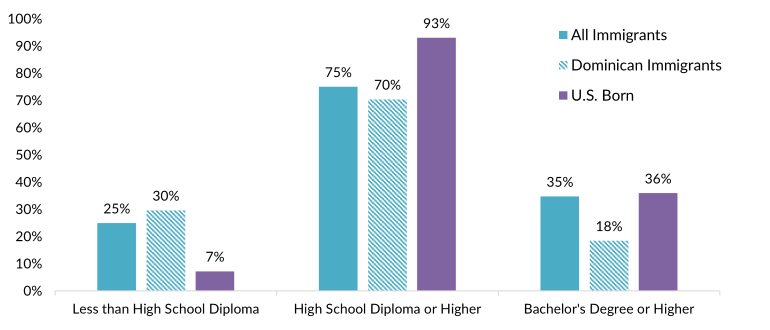
Note: Percentages may not add up to 100 as they are rounded to the nearest whole number.
Source: MPI tabulation of data from the U.S. Census Bureau 2022 ACS.
Click here for data on immigrants’ educational attainment by country of origin and overall.
About 1,500 students from the Dominican Republic were enrolled in U.S. colleges and universities in the 2022-23 school year, according to the Institute of International Education. They accounted for about 13 percent of the 11,700 students from the Caribbean studying in the United States, and less than 1 percent of the more than 1 million total U.S. international students.
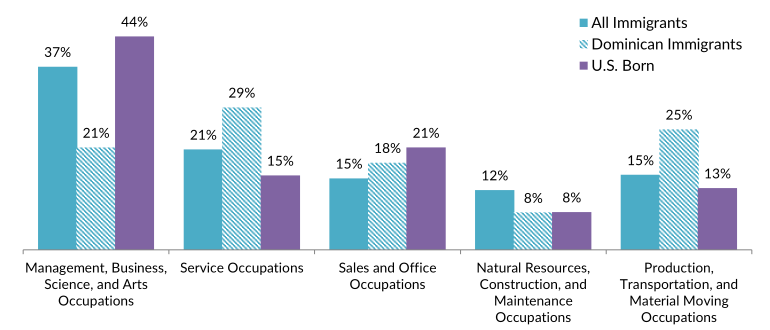
Dominicans have approximately the same labor force participation rate as the overall foreign-born population (66 percent and 67 percent, respectively), which is higher than that of the native born (62 percent). Dominicans are more likely than native- and overall foreign-born workers to work in service and production, transportation, and material moving occupations, but less likely to be in management and other professional occupations (see Figure 6).
Figure 6. Employed Workers in the Civilian Labor Force (ages 16 and older), by Occupation and Origin, 2022
Note: Percentages may not add up to 100 as they are rounded to the nearest whole number.
Source: MPI tabulation of data from the U.S. Census Bureau 2022 ACS.
Dominican immigrants tend to have much lower incomes than the native- and overall foreign-born populations. In 2022, the median household income of Dominican immigrants was $50,500, lower than the $74,600 for U.S.-born households and $75,500 for all immigrant households.
Poverty rates are significantly higher among Dominican immigrants than among the foreign-born and U.S.-born populations. In 2022, 21 percent of Dominican immigrants were living in poverty compared to 12 percent of the native born and 14 percent of all immigrants. (The U.S. Census Bureau defines poverty as having an income below $29,700 for a family of four in 2022.)
Immigration Pathways and Naturalization
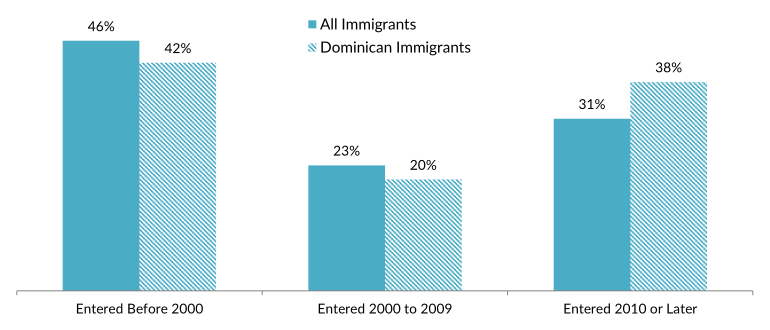
Dominicans are more likely than other immigrants to have arrived since 2010. About 38 percent of the Dominican population entered after 2010, compared to 31 percent of the total foreign-born population (see Figure 7).
Figure 7. Dominican and All Immigrants in the United States, by Period of Arrival, 2022
Note: Percentages may not add up to 100 as they are rounded to the nearest whole number.
Source: MPI tabulation of data from the U.S. Census Bureau 2022 ACS.
As of 2022, 56 percent of Dominican immigrants were U.S. citizens, compared to 53 percent of the total foreign-born population. They were the fourth-largest group to naturalize in fiscal year (FY) 2023 (after immigrants from Mexico, India, and the Philippines), accounting for 4 percent of the 878,500 newly naturalized immigrants. At the same time, among groups with large numbers of immigrants receiving U.S. citizenship that year, Dominicans spent the third-longest median amount of time as legal permanent residents, at 9.5 years, after Mexicans and Canadians (about 10.4 years).
Click here for an overview of naturalization trends among U.S. immigrants.
In FY 2022, nearly 40,200 Dominicans became lawful permanent residents (LPRs, also known as green-card holders), accounting for about 4 percent of the 1 million green-card recipients that year. Ninety-nine percent of Dominicans obtained a green card through family sponsorship (see Figure 8).
Figure 8. Immigration Pathways of Dominican and All Lawful Permanent Residents in the United States, FY 2022
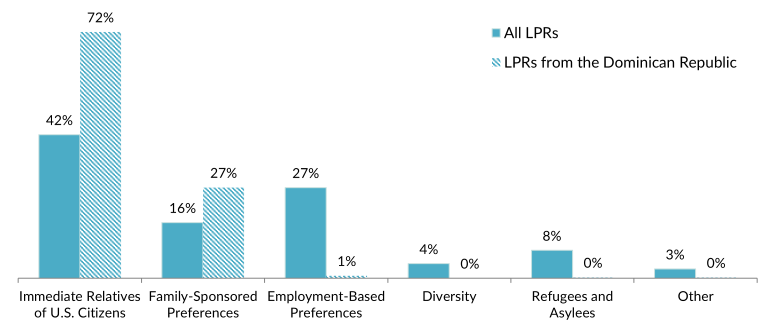
Notes: Immediate Relatives of U.S. Citizens: Includes spouses, minor children, and parents of U.S. citizens. Family-Sponsored Preferences: Includes adult children and siblings of U.S. citizens as well as spouses and children of green-card holders. The Diversity Visa lottery was established by the Immigration Act of 1990 to allow entry to immigrants from countries with low rates of immigration to the United States. The law states that 55,000 diversity visas in total are made available each fiscal year. Individuals born in the Dominican Republic were not eligible for the 2025 lottery. Percentages may not add up to 100 as they are rounded to the nearest whole number.
Source: MPI tabulation of data from Department of Homeland Security (DHS), “Table 10D: Persons Obtaining Lawful Permanent Resident Status by Broad Class of Admission and Region and Country of Birth: Fiscal Year 2022,” updated August 21, 2023, available online.
Unauthorized Immigrant Population
Although most Dominican immigrants in the United States are legally present, approximately 164,000 were unauthorized as of 2019, according to Migration Policy Institute (MPI) estimates, comprising about 1 percent of all 11 million unauthorized immigrants.
Click here for an overview of the unauthorized immigrant population in the United States as of mid-2022.
As of March 2024, U.S. Citizenship and Immigration Services (USCIS) reported that about 1,440 unauthorized immigrants from the Dominican Republic held Deferred Action for Childhood Arrivals (DACA) status, which provides temporary deportation relief and work authorization to individuals who arrived as children. These individuals represented a very small share of the nearly 528,300 DACA participants.
Click here to view the top origin countries of DACA recipients and their U.S. states of residence.
Dominican immigrants are less likely than the overall foreign-born population to lack health insurance, with 13 percent uninsured in 2022 compared to 18 percent of all immigrants. This may be in part because of higher enrollment rates in public insurance than both the U.S.- and total foreign-born populations (see Figure 9).
Figure 9. Health Coverage for Dominican Immigrants, All Immigrants, and the U.S. Born, 2022
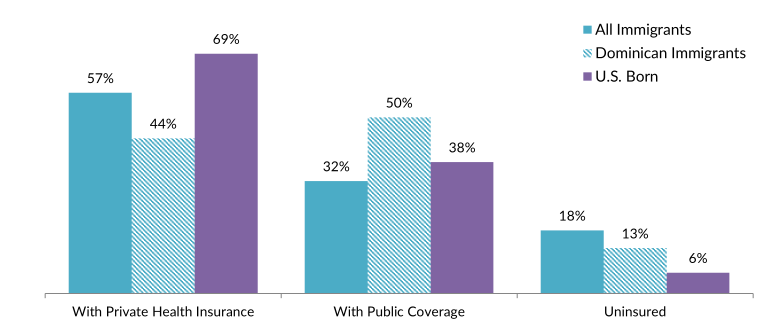
Note: The sum of shares by type of insurance is likely to be greater than 100 because people may have more than one type of insurance.
Source: MPI tabulation of data from the U.S. Census Bureau 2022 ACS.
The Dominican diaspora is the 18th largest in the United States and is comprised of approximately 2.7 million U.S. residents who were either born in the Dominican Republic or reported Dominican ancestry or origin, according to MPI tabulation of data from the U.S. Census Bureau’s 2022 American Community Survey (ACS).
Click here to see estimates of the top 35 diaspora groups in the United States in 2022.
The United States is the most popular destination for Dominicans living abroad, accounting for nearly three-quarters of all emigrants from the Dominican Republic, according to 2020 United Nations Population Division estimates. Spain is home to the next largest population (184,800), followed by Italy (48,100), Puerto Rico (46,900), and Chile (36,500).
Click here to view an interactive map showing where immigrants from the Dominican Republic and other countries have settled worldwide.
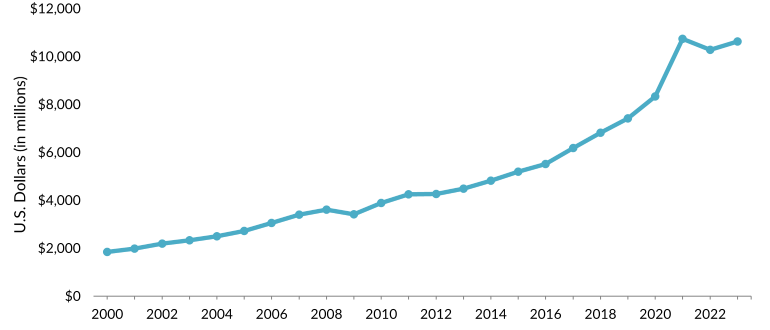
Dominicans abroad and others sent $10.6 billion in remittances to the Dominican Republic via formal channels in 2023, according to World Bank estimates (see Figure 10). That represents a $6.7 billion increase since 2010. Remittances increased sharply during the COVID-19 pandemic, jumping from $7.4 billion in 2019 to $10.7 billion in 2021. Remittances represented approximately 9 percent of the country’s gross domestic product (GDP) in 2023.
Figure 10. Annual Remittance Flows to the Dominican Republic, 2000-23
Source: MPI tabulation of data from the World Bank Global Knowledge Partnership on Migration and Development (KNOMAD), “Remittance Inflows,” June 2024 update, available online.
Click here to view an interactive chart showing annual remittances received by and sent to the Dominican Republic and other countries.
Sources
Duany, Jorge. 2002. “Los Países:” Transnational Migration from the Dominican Republic to the United States. Paper presented at the Migration Dialogue-sponsored seminar Migration and Development: Focus on the Dominican Republic, Santo Domingo, Dominican Republic, March 7-9, 2002. Available online.
Gibson, Campbell J. and Kay Jung. 2006. Historical Census Statistics on the Foreign-Born Population of the United States: 1850-2000. Working Paper no. 81, U.S. Census Bureau, Washington, DC, February 2006. Available online.
Guarnizo, Luis. 1994. Los Dominicanyorks: The Making of a Binational Society. The Annals of the American Academy of Political and Social Science 533 (1): 70-86.
Hernández, Ramona and Sophia Monegro. 2021. Dominican Americans. Oxford Bibliographies, July 28, 2021. Available online.
Hernandez, Ramona, Francisco Rivera-Batiz, and Sidie Sisay. 2022. Dominicans in the United States: A Socioeconomic Profile 2022. New York: City University of New York (CUNY) Dominican Studies Institute. Available online.
Institute of International Education (IIE). 2023. International Students: All Places of Origin. Available online.
Knowledge Partnership on Migration and Development (KNOMAD)/World Bank Group. 2024. Annual Remittances Data. June 2024 update. Available online.
Marrow, Brandon and Jeanne Batalova. 2024. Naturalized Citizens in the United States. The Migration Information Source, July 10, 2024. Available online.
Migration Policy Institute (MPI), Migration Data Hub. N.d. U.S. Immigrant Population by State and County. Accessed August 2, 2024. Available online.
Organization for Economic Cooperation and Development (OECD) and Centro de Investigaciones Económicas, Administrativas y Sociales (CIECAS). 2017. Interrelations between Public Policies, Migration and Development in the Dominican Republic. Paris: OECD Publishing. Available online.
United Nations Population Division. 2020. International Migrant Stock 2020: Destination and Origin. Available online.
U.S. Census Bureau. 2024. 2022 American Community Survey. Access from Steven Ruggles, Sarah Flood, Matthew Sobek, Daniel Backman, Annie Chen, Grace Cooper, Stephanie Richards, Renae Rodgers, and Megan Schouweiler. IPUMS USA: Version 15.0 [dataset]. Minneapolis, MN: IPUMS, 2024. Available online.
---. N.d. 2022 American Community Survey—Advanced Search: S0201 Selected Population Profile in the United States. Accessed August 2, 2024. Available online.
U.S. Citizenship and Immigration Services (USCIS). 2024. Count of Active DACA Recipients by Country of Birth as of March 31, 2024. Updated June 2024. Available online.
---. 2024. Naturalization Statistics. Updated May 9, 2024. Available online.
U.S. Department of Homeland Security (DHS), Office of Homeland Security Statistics (OHSS). 2024. 2022 Yearbook of Immigration Statistics. Washington, DC: DHS, OHSS. Available online.