U.S. Immigrant Population Spotlights
Showing 161–170 of 277 results
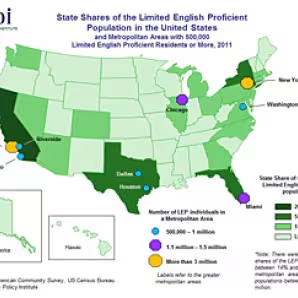
Limited English Proficient Population of the United States in 2011
In 2011, the U.S. Limited English Proficient population reached 25.3 million, and nearly one in five were native born.
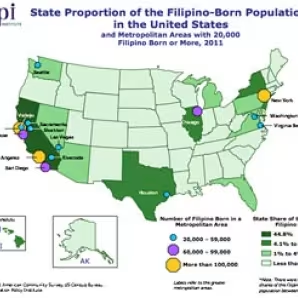
Filipino Immigrants in the United States
In 2011, 65 percent of Filipino immigrants had naturalized as U.S. citizens.
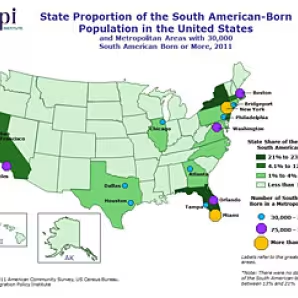
South American Immigrants in the United States
Nearly half of all South American immigrants in the United States lived in just two metropolitan areas—New York and Miami—in 2011.
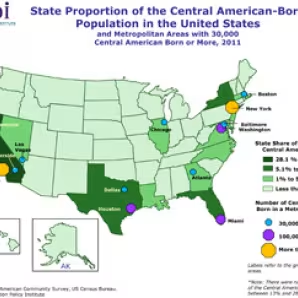
Central American Immigrants in the United States
The number of U.S. immigrants from Central America grew more than 60-fold from 1960 to 2011.
Mexican Immigrants in the United States
In 2011, Mexican immigrants in the United States numbered 11.7 million, yet 59 percent of all unauthorized immigrants were Mexican born and just 24 percent had naturalized.

College-Educated Immigrants in the United States
In 2011, college-educated immigrants made up nearly half of U.S. medical scientists but faced high rates of brain waste.
Temporary Admissions of Nonimmigrants to the United States
About 46.5 million nonimmigrant admissions were recorded to the United States in 2010.
Green Card Holders and Legal Immigration to the United States
Of the estimated 13.1 million green-card holders residing in the United States as of January 2011, an estimated 8.5 million were eligible to naturalize but had not yet done so.
Refugees and Asylees in the United States
In 2011, the U.S. refugee admission ceiling stood 65 percent below its 1980 peak, and the United States admitted 56,384 of the 80,000 authorized.
European Immigrants in the United States
Europeans made up just 12 percent of all U.S. immigrants in 2010, down from 75 percent in 1960.