Rooted in the Valley: Immigrants in Napa County’s Communities and Economy

Related Content
Highlights
Immigrants made up 29 percent of Napa County’s workforce as of 2019–23, with those working in the wine and hospitality industry generating an estimated $1.5 billion in county GDP.
- 21 percent of residents and 29 percent of Napa County’s workforce were immigrants as of 2019-2023, a review of Census data showed. Three-quarters had resided in the United States for 20 or more years, with Mexico the leading origin country.
- Nearly half of all Napa County children had at least one foreign-born parent, and immigrants in the wine and hospitality industry contributed an estimated U.S. $1.5 billion—11 percent—of county GDP.
- Unauthorized immigrants were 14 percent of county workers; economic simulations showed their departure would trigger significant losses, including cascading effects on employment and household spending.
- Heightened immigration enforcement poses serious risks to Napa County's economy.
Executive Summary
In Northern California’s Napa Valley, one of the world’s most famous wine-growing regions, immigrants have long been an integral part of the workforce and local communities. Of Napa County’s 135,000 residents, 21 percent (29,000 people) were foreign born as of 2019–23. Immigrants made up an even greater share of workers in the county—29 percent—when taking into account people who live and work in the county as well as those who commute to it from nearby areas.
"In Northern California’s Napa Valley, one of the world’s most famous wine-growing regions, immigrants have long been an integral part of the workforce and local communities."
This report examines the characteristics of immigrants in Napa County, and how this profile has changed since a prior Migration Policy Institute (MPI) study of this population in 2012. In addition to the overall immigrant population, the report examines the county’s Latino residents (both foreign and U.S. born) and its working-age population (ages 18–64). The report employs an economic impact model to estimate the value of all foreign-born workers’ contributions to the Napa County wine and hospitality industry, estimated at $1.5 billion or 11 percent of the county gross domestic product (GDP). Using this model, the study also examines the contributions of unauthorized immigrant workers to the wine and hospitality industry, and by extension, what effects broadly expanded immigration enforcement could have on the local economy.
An Immigrant Population with Deep Roots
Approximately two-thirds of immigrants in Napa County were born in the Latin American and Caribbean region, with Mexico being by far the top sending country (57 percent of all immigrants in 2019–23). Data from the U.S. Census Bureau’s American Community Survey paint a picture of an immigrant population that, over the years, has settled down, started families, and become successfully incorporated into local communities.
- The number of immigrants in Napa County (29,000 people) and the immigrant share of all residents (21 percent) in 2019–23 represent fairly significant declines from 2006–10, given the county’s relatively small population.
- Three-quarters of immigrants in Napa County had lived in the United States for 20 years or more. Latino immigrants were particularly likely to have a long history of U.S. residence, while non-Latino immigrants made up more than half of those in the country for less than ten years. Moreover, relatively few immigrants are recent arrivals: 8 percent of all immigrants in the county had been in the United States for less than ten years.
- Immigrants in the county tend to be older than U.S.-born residents. Just 3 percent of immigrants were children under 18 years old, while one-quarter of U.S.-born residents were children.
- At the same time, nearly half (47 percent) of all children in the county had at least one immigrant parent in 2019–23—a share that has remained steady since the 2012 MPI report, highlighting the continued prominence of the second generation among the county’s youngest residents.
- Latinos (both foreign and U.S. born) represented 35 percent of the total county population in 2019–23, an 18-percent increase since 2006–10. This growth was driven primarily by U.S.-born Latinos, many of whom are the children of immigrants.
- Almost half (48 percent) of immigrants were naturalized U.S. citizens in 2023, a sharp increase from the finding of 30 percent in the 2012 MPI report and a strong marker of integration. In addition to naturalized U.S. citizens, as of 2023, 26 percent of immigrants in Napa County were either lawful permanent residents (also known as green-card holders) or temporary visa holders. The remaining one-quarter were unauthorized immigrants, some of whom had a temporary status that has protected them from deportation and authorized them to work; this includes asylum seekers, humanitarian parolees, Deferred Action for Childhood Arrivals (DACA) recipients, and Temporary Protected Status (TPS) holders.
- Nearly half of immigrants ages 5 and older reported speaking English “very well” or as their only language in 2019–23. Slightly more than half of immigrants had limited English proficiency, including about one-quarter who spoke little or no English.
Socioeconomic Well-Being and Disparities
Analysis of the socioeconomic characteristics of Napa County immigrants pointed to both gains and gaps with other county residents.
- The median household income of county immigrant families was $108,000—higher than the statewide average for immigrants of $99,000. The median income of Latino immigrant households in Napa was lower ($84,000), while that of non-Latino immigrants was higher ($156,000).
- While the low-income share of Latino immigrants remains high (that is, those who have a family income lower than 200 percent of the federal poverty level), this share has fallen since the earlier MPI study, from 39 percent to 31 percent.
- Despite rising housing prices, 58 percent of the county’s immigrants lived in owned homes in 2023. Rates varied by legal status. For example, 72 percent of naturalized U.S. citizens lived in owned homes, while 27 percent of unauthorized immigrants did so.
- Health insurance coverage rates were higher for immigrants in Napa County than in California as a whole. Overall, 89 percent of all immigrants and 86 percent of Latino immigrants in the county had some form of coverage in 2019–23. Statewide, these figures were 87 percent and 79 percent, respectively.
- At the same time, participation in public benefits programs such as Medicaid, the Supplemental Nutrition Assistance Program (SNAP), and Supplemental Security Income (SSI) remained lower for low-income immigrant families than for their U.S.-born counterparts.
Immigrants in the Workforce
In 2019–23, 71 percent of Napa County’s immigrant residents were of prime working age (25 to 64), a much larger share than U.S.-born residents (46 percent). That said, not everyone who works in Napa lives in the county: 34 percent of all people who worked in Napa County in 2019–23 commuted in from nearby areas, most notably Solano County. This figure, which includes both immigrants and native-born residents, has increased since MPI’s 2012 report.
- Among immigrants who work in Napa County, the share who also live in the county declined by 11 percent between 2006–10 and 2019–23, while the share who commute in from outside the county rose by 13 percent. And though the number of both native- and foreign-born commuters increased, immigrant workers were more likely to be commuters (38 percent) compared to U.S.-born workers (32 percent). Though many factors may explain these changes, these trends echo concerns of population displacement due to lack of housing and the rising cost of living in the county.
- Looking at the Napa County workforce overall—both those who live and work in the county and commuters—immigrants were overrepresented. They made up 21 percent of the county population in 2019–23 but 29 percent of workers ages 18–64. Similarly, Latinos (both native and foreign born) made up 35 percent of the county’s residents but 40 percent of its workers.
- The top five industries of employment for immigrants in Napa County as of 2019–23 were manufacturing (in which 17 percent of all employed immigrants worked), health care (13 percent), agriculture (12 percent), accommodation and food services (10 percent), and professional services (10 percent). Many manufacturing and accommodation and food services jobs are related to the wine industry. Across industries in 2023, the majority of workers were U.S. born, except in agriculture, in which 71 percent of workers were immigrants.
- Immigrant men and women were more likely to work full time, year round than their U.S.-born counterparts. Nonetheless, immigrants’ median earnings were 77 percent those of U.S.-born workers in 2019–23.
- Relatively high shares of immigrant workers did not have a high school diploma: 39 percent of immigrant men and 29 percent of immigrant women in 2019–23, compared to 6 percent of U.S.-born workers (men and women combined). On the other hand, 30 percent of immigrant women workers had a university degree, a significantly higher share than immigrant men (19 percent).
The Contributions of Immigrant Workers to the Napa County Economy
To estimate the contributions of all immigrant workers and of unauthorized immigrant workers specifically to Napa County’s wine and hospitality industry,1 a leading sector within the local economy, MPI researchers used an input-output model to simulate scenarios in which all jobs held by these workers disappear. These hypothetical scenarios generated several important insights into the local economy:
- Considering both direct and multiplier effects, it is estimated that immigrant workers in the wine and hospitality industry (including naturalized U.S. citizens, lawfully present noncitizens, and the unauthorized) contribute $1.5 billion to Napa County’s GDP annually. By comparison, the 2012 MPI report found that immigrants’ economic contributions to the county at the time had a lower-bound estimate of $317 million and an upper-bound estimate of $1.07 billion.
- In light of heightened immigration enforcement across the country, the researchers also used the model to calculate the economic impacts specifically of unauthorized immigrant workers in Napa County’s wine and hospitality industry. This simulation found that unauthorized immigrants add an estimated $366 million in value annually to the local GDP, when considering both direct contributions (their labor) and indirect contributions (their work’s impact on other sectors). Removing this group of workers from the wine and hospitality industry would generate job losses in other service activities that support agriculture as well as warehousing and tourism-related services. These negative impacts would go beyond unauthorized immigrants and affect U.S.-born and lawfully present foreign-born workers.
- Even under the assumption that unauthorized immigrant workers do not pay payroll taxes (though in reality some do), Napa County and subcounty tax revenues would decline by approximately $28 million annually due to lower collections from property, sales, and special assessment taxes.
The demographic and workforce profiles in this report, along with the economic impact simulation, provide information that could help inform local policy choices and planning at a time when the region is facing a range of challenges—from the high cost of living, to stagnating population growth, to changing demand and supply-side trends in the wine industry, to stepped-up immigration enforcement.
1. Introduction
Northern California’s Napa Valley is a world-famous wine-growing region, with more than 500 wineries.2 For Napa County as a whole, the wine industry accounts for more than 70 percent of all jobs.3 Wineries also attract nearly 4 million tourists a year to the area and contribute more than $36 billion annually to the U.S. economy.4
Agriculture and manufacturing, including the planting and harvesting of grapes and bottling of wine, are thus major aspects of the regional economy. They are also sectors that have long relied on immigrant labor, primarily that of workers from Mexico.5 Napa County had approximately 29,000 foreign-born residents as of 2019–23, representing 21 percent of the total population.6 Immigrants were overrepresented in the county’s workforce, comprising 29 percent of all workers (ages 18 to 64). Yet the immigrant shares of both the county’s population and its workforce have decreased.7 These trends in Napa County are part of a broader story of slowing growth in California’s immigrant population,8 but they stand in contrast with trends nationwide, where the number of immigrants and the immigrant share of the U.S. population have grown markedly since 2010.9
Figure 1. Map of Napa County and Neighboring Counties
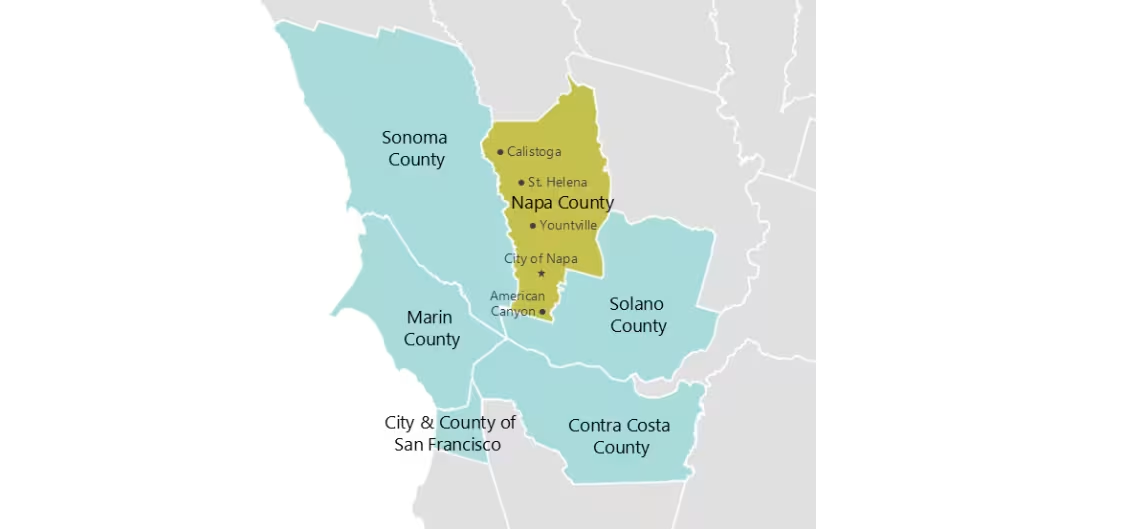
To examine changes in the sociodemographic profile of immigrants in Napa County, this report analyzes data from the U.S. Census Bureau’s American Community Survey, pooled for 2019–23, and compares them to data from an earlier point in time, the 2006–10 period (see Box 1). Given Napa County’s sizeable Latino population, which includes both U.S.- and foreign-born individuals, some parts of this analysis look specifically at the county’s Latino residents. Some sections also compare the characteristics of immigrants living in Napa County with those in California overall, in surrounding Bay Area counties (Contra Costa, Marin, San Francisco, Solano, and Sonoma), or in Napa County’s five incorporated areas (American Canyon, Calistoga, the City of Napa, St. Helena, and Yountville).
This report comes at a time when immigration pathways to the United States are narrowing and immigrant communities are facing heightened immigration enforcement activity. The latter is of particular relevance for states such as California, where one-fifth of all unauthorized immigrants in the country resided in 2023.10 The implications of such policies for Napa County’s wine industry are considered in the last section of this report, which estimates potential job losses and declines in the industry’s gross sales, the county’s gross domestic product (GDP), and local tax revenue that could occur if many immigrant workers were to be deported or leave the country voluntarily.
With an already declining foreign-born population, and an increasing share of children born to immigrant parents, Napa County is representative of the many communities across the United States whose economic reliance on foreign labor is running headlong into demographic shifts and sharply expanded immigration enforcement. This report aims to describe these dynamics as they are, and how they could potentially evolve.
Box 1. About This Study and Its Methodology
Unless otherwise stated, this analysis is based on 2019–23 microdata from the U.S. Census Bureau’s American Community Survey (ACS). Pooling five years of ACS data ensures large enough sample sizes to accurately examine the characteristics of smaller populations, such as immigrants in Napa County. The authors use a proprietary Migration Policy Institute (MPI) methodology of assigning legal status in ACS data to examine the legal statuses of the county’s immigrant residents and workers. In some sections, the authors also analyze administrative data to expand the portrait of socioeconomic trends in the county. Finally, in order to estimate immigrant workers’ contribution to the county economy, the authors ran an input-output model, using the economic impact modeling software IMPLAN.
This report compares and updates many indicators and methods discussed in an earlier MPI report: Randy Capps, Kristen McCabe, and Michael Fix, Profile of Immigrants in Napa County (Washington, DC: MPI, 2012). To ensure comparability across time, the present study uses a five-year ACS dataset for 2006–10 to describe that earlier period (rather than the two-year dataset used in parts of the 2012 report), in order to match the pooling of five years of data for 2019–23. As such, some data points may slightly differ from those published in the 2012 report.
2. Napa County’s Immigrant Population
Immigrants are an important part of the social fabric of Napa County. Immigrants and Latinos (both foreign and U.S. born) represent large shares of the county’s population, as they do statewide. In California, 27 percent of the population was foreign born as of 2019–23, and neighboring Mexico was the country of origin for 36 percent of immigrants. Native- and foreign-born Latinos combined accounted for 40 percent of the state’s population, the largest racial and ethnic group.
This section examines the sociodemographic and household characteristics of the immigrant and Latino populations in Napa County, and how they compare to patterns in neighboring areas and California as a whole. Among other topics, it describes the immigrant population’s size and origins, family and workforce characteristics, English proficiency, and public benefits enrollment.
A. Trends and Origins of the Immigrant Population
Between 2006–10 and 2019–23, the total population of Napa County largely remained flat. Beneath this topline figure, however, lies diverging trends: The immigrant population shrunk in size by 7 percent, while the native-born population grew by 3 percent (see Table 1). The slowing overall population growth in Napa County is part of a broader statewide trend of population decline, with more people leaving than moving to California in the last two decades. Affordability—especially in housing—is a key driver of this exodus and has especially affected low- and middle-income individuals.11
During the same period, Napa County’s Latino population grew by 19 percent, driven specifically by a 47-percent increase in the number of native-born Latino residents. The growth of the native-born Latino population suggests the integration of earlier immigrants who have put down roots in Napa and who have U.S.-born children. As of 2019–23, more than one-third of county residents were Latino.
Table 1. Population Changes in Napa County, between 2006–10 and 2019–23
|
2019–23 |
Change from 2006–10 to 2019–23 |
|
|---|---|---|
| Total Population |
135,000 |
1% |
|
Foreign Born |
29,000 |
-7% |
|
Native Born |
107,000 |
3% |
|
Latinos |
48,000 |
19% |
|
Foreign Born |
18,000 |
-9% |
|
Native Born |
29,000 |
47% |
|
Non-Latinos |
88,000 |
-7% |
|
Foreign Born |
10,000 |
-5% |
|
Native Born |
77,000 |
-7% |
| Foreign-Born Share of Total Population |
21% |
-8% |
| Latino Share of Total Population |
35% |
18% |
| Foreign-Born Share of Latino Population |
38% |
-23% |
The top countries of birth for immigrants living in Napa County in 2019–23 were Mexico (57 percent) and the Philippines (14 percent). In some nearby counties, the foreign-born population’s origins were strikingly different (see Table 2). For example, while 65 percent of Napa County’s foreign-born population was from the Latin American and Caribbean region and 23 percent from Asia, the opposite was true in the City and County of San Francisco, where 65 percent of the foreign born were from countries in Asia and 18 percent from the Latin American and Caribbean region.
Table 2. Origins of Immigrants in Napa County and Selected Bay Area Counties, 2019–23
|
Napa |
Contra Costa |
Marin |
San Francisco |
Solano |
Sonoma |
|
|---|---|---|---|---|---|---|
| Total Population |
135,000 |
1,155,000 |
257,000 |
836,000 |
449,000 |
486,000 |
|
Foreign Born |
29,000 |
304,000 |
47,000 |
281,000 |
93,000 |
78,000 |
|
Born in Latin America and the Caribbean |
19,000 |
115,000 |
19,000 |
50,000 |
40,000 |
49,000 |
|
Born in Asia |
6,000 |
145,000 |
12,000 |
182,000 |
44,000 |
14,000 |
|
Born Elsewhere |
3,000 |
44,000 |
16,000 |
49,000 |
9,000 |
15,000 |
|
Native Born |
107,000 |
851,000 |
210,000 |
554,000 |
357,000 |
407,000 |
| Foreign-Born Share of Total Population |
21% |
26% |
18% |
34% |
21% |
16% |
| Latin American and Caribbean Share of Foreign-Born Population |
65% |
38% |
40% |
18% |
43% |
63% |
| Asian Share of Foreign-Born Population |
23% |
48% |
26% |
65% |
47% |
18% |
B. Napa County’s Cities
In a region renowned for wine production, Napa Valley’s localities are diverse in their soil composition, elevation, and temperature, creating distinctive conditions for grape-growing.12 Napa County is home to five incorporated cities and towns: the City of Napa (the county seat), American Canyon, Calistoga, St. Helena, and Yountville.
The City of Napa had the largest immigrant population in 2019–23, with 21 percent of its residents—approximately 17,000 people—born in another country (see Table 3). The city’s population was also 41 percent Latino, with about 60 percent of Latinos U.S. born and 40 percent foreign born. American Canyon had the second largest immigrant population (7,000 people), and immigrants made up 31 percent of all residents, the largest foreign-born share of the jurisdictions studied. Smaller immigrant populations lived in Calistoga, St. Helena, and Yountville (approximately 1,000 or fewer each), but immigrants made up at least one-quarter of all residents in Calistoga and St. Helena.
Table 3. Immigrant and Latino Populations in Napa County Incorporated Cities and Towns, 2019–23
|
Napa City |
American Canyon |
Calistoga |
St. Helena |
Yountville |
|
|---|---|---|---|---|---|
| Total Population |
79,000 |
22,000 |
5,000 |
5,000 |
3,000 |
|
Foreign Born |
17,000 |
7,000 |
1,000 |
1,000 |
<1,000 |
|
Native Born |
62,000 |
15,000 |
4,000 |
4,000 |
3,000 |
|
Latinos |
32,000 |
7,000 |
2,000 |
1,000 |
1,000 |
|
Foreign Born |
13,000 |
2,000 |
1,000 |
1,000 |
<1,000 |
|
Native Born |
19,000 |
4,000 |
1,000 |
1,000 |
<1,000 |
|
Non-Latinos |
47,000 |
15,000 |
3,000 |
4,000 |
3,000 |
|
Foreign Born |
4,000 |
4,000 |
<1,000 |
1,000 |
<1,000 |
|
Native Born |
43,000 |
10,000 |
3,000 |
3,000 |
3,000 |
| Foreign-Born Share of Total Population |
21% |
31% |
28% |
25% |
13% |
| Latino Share of Total Population |
41% |
31% |
45% |
26% |
17% |
| Foreign-Born Share of Latino Population |
40% |
34% |
56% |
53% |
30% |
C. Time in the United States
Close to three-quarters (74 percent) of immigrants in Napa County had resided in the United States for at least two decades as of 2019–23, and another 12 percent had between 15 and 19 years of U.S. residence (see Figure 2). These numbers paint a picture of a well-established immigrant population with deep ties in the country.
Figure 2. Length of U.S. Residence of Immigrants in Napa County, 2019–23
In contrast, there are relatively few recent immigrants living in Napa County. Just 8 percent of immigrants in the county had been in the United States for less than ten years as of 2019–23. Notably, while Latino immigrants made up two-thirds of longer-term immigrants, the majority of recent immigrants (53 percent) are not Latino (see Figure 3).
Figure 3. Recent and Longer-Term Immigrants in Napa County, by Latino Ethnicity, 2019–23
D. Age Distribution
Most immigrants in Napa County are of prime working age. In the 2019–23 period, 71 percent of all immigrants in the county were between ages 25 and 64 (see Figure 4). Less than half (46 percent) of U.S.-born residents of Napa County were in the same age category.
Relatively small shares of Napa County’s immigrant population were comprised of children (3 percent) and young adults ages 18–24 (5 percent) compared to the native-born population (24 percent and 10 percent, respectively) in 2019–23. At the other end of the age spectrum, equal shares of immigrants and the U.S. born were age 65 or older (21 percent). These figures mean that immigrants in Napa County, on average, are older than their U.S.-born counterparts.
Figure 4. Age Distribution of Immigrant and U.S.-Born Residents of Napa County, 2019–23
E. Children of Immigrants
In Napa County, nearly half (47 percent) of all children in 2019–23 had at least one immigrant parent (see Table 4). This was even more likely to be the case for Latino children, 67 percent of whom had at least one immigrant parent. More than half (53 percent) of all children in Napa County were Latino, either U.S. or foreign born.
Table 4. Children in Napa County, by Latino Ethnicity and Parental Nativity, 2019–23
|
Estimate |
|
|---|---|
| All Children |
26,000 |
|
At Least One Immigrant Parent |
12,000 |
|
Native-Born Parents Only |
14,000 |
|
Latino Children |
14,000 |
|
At Least One Immigrant Parent |
9,000 |
|
Native-Born Parents Only |
5,000 |
|
Non-Latino Children |
12,000 |
|
At Least One Immigrant Parent |
3,000 |
|
Native-Born Parents Only |
9,000 |
| Share of All Children with at Least One Immigrant Parent |
47% |
| Latino Share of All Children |
53% |
| Share of Latino Children with at Least One Immigrant Parent |
67% |
Across Napa County’s six school districts, an estimated 19,000 students were enrolled in kindergarten through high school in the 2023–24 school year (see Table 5). The majority of students—about 16,000—attended schools in Napa Valley Unified School District, while St. Helena and Calistoga Unified School Districts had about 1,000 students each. Much smaller numbers of students attended schools in the districts of Howell Mountain, Pope Valley, and the Napa County Office of Education, which runs an alternative school (fewer than 200 students each).
County-wide, 59 percent of students identified as Latino, 25 percent as non-Latino White, and 6 percent as Filipino. However, student characteristics varied by district. In Calistoga, 88 percent of students were Latino, the highest share of the studied school districts. St. Helena, meanwhile, had the highest non-Latino White share of students (42 percent).
Table 5. Children Enrolled in Napa County and Selected School Districts, by Race or Ethnicity, 2023–24
|
Napa County (Total) |
Napa Valley Unified School District |
St. Helena Unified School District |
Calistoga Unified School District |
|
|---|---|---|---|---|
| Total Student Population |
19,000 |
16,000 |
1,000 |
1,000 |
|
Share Who Are Latino |
59% |
58% |
53% |
88% |
|
Share Who Are Non-Latino White |
25% |
25% |
42% |
9% |
|
Share Who Are Filipino |
6% |
6% |
0% |
1% |
|
Share Who Are Another Race/Ethnicity |
10% |
11% |
4% |
3% |
F. Legal Status and Mixed-Status Households
Leveraging a methodology developed by MPI researchers in partnership with demographers at The Pennsylvania State University and Temple University for assigning legal status in U.S. Census Bureau data, MPI estimates that in 2023, nearly three-quarters of immigrants in Napa County had a legal status (see Figure 5). Close to half (48 percent) were naturalized U.S. citizens—a considerable increase since 2006–08, when MPI researchers found that 30 percent of the county’s immigrants were naturalized U.S. citizens.13 An additional 26 percent of the county’s immigrant residents in 2023 held some other legal status, whether as a lawful permanent resident (i.e., green-card holder) or holder of a temporary visa (such as for work or study).
MPI estimates that there were approximately 8,400 unauthorized immigrants living in Napa County in 2023, representing 25 percent of the foreign-born population. Some individuals within this group held a temporary, liminal status offering work authorization and protection from deportation, such as Deferred Action for Childhood Arrivals (DACA) or Temporary Protected Status (TPS). In surrounding counties, the unauthorized share of immigrants was higher in Sonoma (30 percent) and Marin (28 percent), and lower in Solano (22 percent), Contra Costa (20 percent), and San Francisco (14 percent).
Figure 5. Legal Status of Immigrants in Napa County, 2023
Nearly 10,000 Napa County residents who themselves held a legal status in 2023 shared a household with at least one unauthorized immigrant, also known as a mixed-status household (see Table 6). This population included an estimated 4,000 children who lived with at least one unauthorized immigrant parent; 91 percent of these children were U.S. citizens.
Table 6. Napa County Residents Who Are Part of Mixed-Status Households, 2023
|
Estimate |
|
|---|---|
| Total Number of People (all ages) Who Hold a Legal Status and Share a Household with One or More Unauthorized Immigrants |
10,000 |
|
Children Who Have a Legal Status and Live with at Least One Unauthorized Immigrant Parent |
4,000 |
|
Share of These Children Who Are U.S. Citizens |
91% |
G. English Proficiency
Nearly half (48 percent) of immigrants ages 5 and older in Napa County either spoke only English at home or spoke it “very well” as of 2019–23. The other 52 percent were Limited English Proficient (LEP), a classification defined as those who reported speaking English less than “very well” in the ACS. A small slice of this LEP population (8 percent of immigrants, or roughly 2,000 people) reported not speaking English at all.
Figure 6. English Proficiency of Immigrants (ages 5 and older) in Napa County, 2019–23
H. Household Income
The median household income for Napa County residents ($129,000) was higher than for residents of California overall ($112,000) in 2019–23.14 This was also true for immigrants in the county, who earned more than immigrants in the state overall: $108,000 versus $99,000, respectively (see Figure 7). But within the county, the median household income for all immigrants was $30,000 lower compared to U.S.-born Napa residents ($138,000).
Income disparities along ethnic lines exist among both immigrants and the U.S. born (though for all groups, incomes in Napa were greater than in the state overall). Latinos in Napa County, and statewide, had lower household incomes than their non-Latino counterparts. In fact, non-Latino immigrants had the highest household incomes of the studied populations, even higher than the non-Latino U.S. born, with median household incomes of $156,000 in Napa County and $129,000 in California.
Figure 7. Median Household Income of Napa County and California Residents, by Nativity and Latino Ethnicity, 2019–23
More than one-quarter of California residents had low incomes in 2019–23, such that their family income was lower than 200 percent of the federal poverty level—equivalent to $30,900 for a family of two adults and two children in 2023.15 The low-income share of Napa County residents was lower, at 18 percent, but varied by nativity and ethnicity (see Figure 8). Among all Napa County immigrants, 26 percent had low incomes, compared to 16 percent of the U.S. born.
Latinos—both immigrants and U.S. born—were more likely to have low incomes than their non-Latino counterparts. In 2019–23, 31 percent of Latino immigrants and 25 percent of U.S.-born Latinos had a family income lower than 200 percent of the federal poverty level, compared to 16 percent of non-Latino immigrants and 12 percent of non-Latino U.S. born. While the low-income share of Latino immigrants remains high, both on its own and relative to other county residents, this figure has decreased since the 2012 MPI study, from 39 percent (based on 2008–09 data) to 31 percent (based on 2019–23 data).16
Figure 8. Low-Income Share of Napa County Residents, by Nativity and Latino Ethnicity, 2019–23
I. Home Ownership
A majority of both immigrant and U.S.-born residents of Napa County lived in owned homes in 2023, though the share for immigrants (58 percent) was lower than for the native born (70 percent). Immigrants’ legal status can affect their likelihood to live in an owned home, and indeed to own a home themselves, due to documentation and credit requirements to purchase a home (e.g., for a social security number, good credit history). As such, 72 percent of naturalized U.S. citizens lived in an owned home, while an almost equal percentage (73 percent) of unauthorized immigrants lived in rented homes (see Figure 9). For lawfully present noncitizens, it was a nearly equal split: 52 percent lived in rented homes and 48 percent in owned homes.
Figure 9. Immigrants Living in Owned vs. Rented Homes in Napa County, by Legal Status, 2023
The prospects of purchasing property in California have worsened in recent years, evidenced by the rapid increase in home prices (see Figure 10). After the 2008–09 recession, the housing bubble burst, bringing home prices in California overall and in Napa County specifically closer to the national average. However, by 2013, California and Napa County home prices had picked up again, and they have since stayed significantly above the national average, only to accelerate after the COVID-19 pandemic. Various factors, such as climate-related insurance costs, have particularly affected the San Francisco Bay area real estate market, making homes less affordable for new buyers, including recent immigrants.17
Figure 10. Home Price Index in the United States, California, and Napa County, 2000–24
J. Health Insurance and Social Safety Nets
Very high shares of Napa County residents have health coverage of one kind or another. In 2019–23, 89 percent of immigrants in the county were insured (slightly higher than the state average of 87 percent) as were 96 percent of U.S.-born county residents. Latino immigrants were slightly less likely than immigrants overall to have health insurance (86 percent), but this rate was still higher than the 79 percent of Latino immigrants statewide who were insured (see Figure 11). Nearly all non-Latino immigrants had some form of insurance: just 6 percent in Napa County and 5 percent statewide were uninsured. For many immigrants, particularly in Napa County, private (including employer-sponsored) insurance was the most common form of health coverage.
About 14 percent of Latino immigrants in Napa County were uninsured as of 2019–23. This is a considerably lower share than the finding in the earlier MPI report that 29 percent of Latino immigrants were uninsured in 2008–09,18 meaning the uninsured share of this population has been cut by half. Many changes have taken place in the health insurance market since then, including the 2014 expansion of Medicaid under the Affordable Care Act and the broadening of immigrant eligibility for Medi-Cal, the state’s Medicaid program.19
Figure 11. Health Insurance Coverage for Immigrants in Napa County and California, 2019–23
While some immigrants have access to social safety nets for low-income families, such as Medicaid, the Supplemental Nutrition Assistance Program (SNAP), and Supplemental Security Income (SSI), many noncitizens do not due to federal restrictions; this includes both unauthorized immigrants, who have long been barred from federally funded benefits, and many lawfully present noncitizens, including most green-card holders who have held that status for less than five years.20
In 2019–23, 11 percent of low-income immigrants in Napa County received SNAP benefits, about half the share of low-income U.S.-born residents (20 percent; see Figure 12). Similarly, immigrants’ participation in Medicaid was 20 percentage points lower than that of U.S.-born people in the same income range. In addition to immigration-related eligibility restrictions, low Medicaid participation rates are partly explained by the high prevalence of private health insurance, which is likely employer-sponsored. In the case of SSI, a cash assistance program that is designed for people with disabilities and has fairly restrictive eligibility rules, the participation rate of low-income immigrants was 3 percent, half that of the U.S. born.
Figure 12. Share of Low-Income Napa County Residents Participating in Public Benefits Programs, by Nativity, 2019–23
3. Profile of Napa County’s Workforce
The San Francisco Bay area is characterized by a high level of worker mobility. In 2019–23, as many as 24,000 workers (ages 18 to 64) commuted to Napa County for work, and 14,000 workers commuted out of the county to jobs elsewhere.21 Combined, the 46,000 people who lived and worked in the county and the 24,000 workers who commuted in gave Napa County a workforce of 70,000 (see Table 7). With more than one-third (34 percent) of the county’s workforce living elsewhere, this section examines the characteristics of all workers, regardless of their place of residence, to more accurately understand the profile of those who contribute to Napa County’s economy.
A. Commuters and Recent Trends
The Napa County workforce (ages 18 to 64) grew moderately, by 6 percent, between 2006–10 and 2019–23 (see Table 7). This growth was led by a 9-percent increase in the number of U.S.-born workers that counterbalanced the 3-percent decrease in the number of immigrant workers, which is linked to the decline in the overall immigrant population discussed in Section 2.A. In 2019–23, immigrant workers represented 29 percent of all Napa County workers, down from 32 percent in 2006–10.
The share of the county’s workforce comprised of commuters has also changed. In 2019–23, 34 percent of workers lived elsewhere and commuted to Napa County, up from 31 percent in 2006–10. Among immigrant workers, the commuter share was higher (38 percent) than among U.S.-born workers (32 percent). The cost of living in Napa County is likely a factor behind the growth in the number of commuters, particularly for immigrants. The number of immigrants both living and working in Napa County dropped by 11 percent since 2006–10 (about 1,000 individuals).
Most workers commuting into Napa County in 2019–23 resided in Solano County (57 percent) or Sonoma County (18 percent). Solano County in particular has experienced significant growth in its foreign-born population since 2006–10.22 Among immigrant workers specifically, an estimated 5,000 commuted from Solano County to Napa County.
Table 7. Change in the Napa County Workforce (ages 18 to 64), by Nativity and Commuter Status, between 2006–10 and 2019–23
|
2019–23 |
Change from 2006–10 to 2019–23 |
|
|---|---|---|
| Total Workers |
70,000 |
6% |
|
County Residents |
46,000 |
0% |
|
Commuters |
24,000 |
1% |
|
Foreign-Born Workers |
21,000 |
-3% |
|
County Residents |
13,000 |
-11% |
|
Commuters |
8,000 |
13% |
|
U.S.-Born Workers |
50,000 |
9% |
|
County Residents |
34,000 |
6% |
|
Commuters |
16,000 |
18% |
| Foreign-Born Share of All Workers |
29% |
-8% |
| Commuter Share of All Workers |
34% |
10% |
| Commuter Share of Foreign-Born Workers |
38% |
17% |
| Commuter Share of U.S.-Born Workers |
32% |
8% |
B. Workforce Composition
Slightly more than half (52 percent) of Napa County’s workforce (ages 18 to 64) was made up of non-Latino U.S.-born workers in 2019–23. Latino workers represented 40 percent of the workforce, including both Latino immigrants (21 percent) and U.S.-born Latinos (19 percent; see Figure 13). The non-Latino immigrant population made up a relatively small 8 percent of the workforce.
Figure 13. Napa County Workers (ages 18 to 64), by Nativity and Latino Ethnicity, 2019–23
C. Legal Status
Two-thirds of Napa County’s immigrant workforce were either naturalized U.S. citizens or lawfully present noncitizens in 2023, according to MPI estimates (see Figure 14). Unauthorized immigrants were overrepresented in the county’s immigrant workforce, making up one-third of foreign-born workers, compared to one-quarter of the county’s overall immigrant population (see Figure 5 above). This is due, in part, to the outsized role unauthorized immigrant workers play in the wine and hospitality industry, as will be discussed in Section 4.
Immigrant workers from the Latin American and Caribbean region were more likely to be unauthorized immigrants (39 percent) than those born in Asia (9 percent) in 2023. Conversely, 72 percent of Asian immigrant workers were naturalized U.S. citizens, compared to 31 percent of Latin American and Caribbean immigrant workers.
The estimated 29 percent of immigrant workers who were lawfully present noncitizens is a diverse group in terms of legal status, including green-card holders and work visa holders, among others. One such visa, the H-2A visa for low-skilled agricultural workers, is critical to filling Napa County’s agricultural workforce needs. In 2025, as many as 33,645 H-2A agricultural workers were employed in California, 453 of whom worked in Napa County.23
Figure 14. Legal Status of Immigrant Workers (ages 18 to 64) in Napa County, 2023
D. Industries of Work and Earnings
The top industry of employment for immigrant workers in Napa County in 2019–23, with 17 percent of all immigrant workers, was manufacturing, which encompasses various facets of wine-making such as bottling and packaging (see Table 8). The next largest industries of employment were health care (13 percent), agriculture (12 percent), accommodation and food services (10 percent), professional services (10 percent), construction (9 percent), and in smaller proportions, retail and educational services (5 percent and 4 percent, respectively).
Among these top industries of employment, the highest-paying was health care, in which immigrants earned $60,000 yearly as of 2019–23 (see Table 8). By comparison, median annual earnings stood at $46,000 for immigrants across all industries. After health care, educational services and manufacturing were the next highest-paying industries for immigrants in the county. The lowest-paying industries for immigrant workers in 2019–23 were retail ($35,000) and accommodation and food services ($35,000), followed by agriculture ($42,000) and professional services ($42,000).
Immigrants working in Napa County generally earned less than their U.S.-born counterparts, except in the low-wage accommodation and food industry. On average, immigrant workers earned 77 cents for each dollar earned by U.S.-born workers. The gaps in earnings were especially stark in the manufacturing and professional services industries, in which immigrants earned 64 percent and 50 percent, respectively, of what U.S.-born workers earned.
Table 8. Top Industries of Employment of Immigrant Workers (ages 18 to 64) and Median Earnings in Napa County, 2019–23
|
Immigrant Workers |
Median Earnings |
|||
|---|---|---|---|---|
|
Number |
Share |
Immigrants |
Immigrant–U.S. Born |
|
| All Industries |
21,000 |
100% |
$46,000 |
77% |
|
Manufacturing |
4,000 |
17% |
$51,000 |
64% |
|
Health Care |
3,000 |
13% |
$60,000 |
85% |
|
Agriculture |
3,000 |
12% |
$42,000 |
70% |
|
Accommodation and Food Services |
2,000 |
10% |
$35,000 |
106% |
|
Professional Services* |
2,000 |
10% |
$42,000 |
50% |
|
Construction |
2,000 |
9% |
$48,000 |
74% |
|
Retail |
1,000 |
5% |
$35,000 |
90% |
|
Educational Services |
1,000 |
4% |
$52,000 |
82% |
|
Other Industries |
4,000 |
19% |
- |
- |
Legal Status of Workers in Top Industries of Employment
Across immigrants’ top industries of employment, there is variation in the shares of workers who are U.S. born, immigrants with a legal status (including naturalized U.S. citizens, green-card holders, and temporary visa holders), and unauthorized immigrants. U.S.-born workers represented the majority of workers overall in 2023 and in all top industries except agriculture, where the reverse was true: 71 percent of all Napa County agricultural workers were immigrants (see Figure 15).
Agriculture also stands out as the industry in which unauthorized immigrants make up the highest share of all workers. MPI estimates that while unauthorized immigrants were 14 percent of all Napa County workers ages 18–64 in 2023, they made up 27 percent of all workers in agriculture.
Still, immigrants working in agriculture were more likely to have a legal status than to lack one. An estimated 44 percent of all agricultural workers in Napa County were immigrants who held some form of legal status. Immigrants with a legal status were also an important segment of the total workforce in health care and manufacturing, representing about 30 percent of all workers in those industries.
Figure 15. Legal Status of All Workers (ages 18 to 64) in Napa County, Selected Top Industries of Employment for Immigrants, 2023
E. Full-Time Year-Round Work
Immigrant workers were more likely than their U.S.-born counterparts to work full time, year round (that is, a minimum of 35 hours a week and 42 weeks a year). This was particularly evident among men and to a smaller extent women (see Figure 16).
Figure 16. Full-Time, Year-Round Share of Workers (ages 18 to 64) in Napa County, by Nativity and Gender, 2019–23
F. Educational Attainment
Among immigrant workers in Napa County, education levels varied by gender. More immigrant men workers (39 percent) than immigrant women workers (29 percent) did not have a high school diploma in 2019–23 (see Figure 17). In comparison, just 6 percent of U.S.-born workers did not have a high school diploma. In addition, among immigrant workers, a high school diploma was the highest level of education obtained by 23 percent of men and 20 percent of women.
On the other end of the education spectrum, immigrant women workers surpassed their male counterparts, with 30 percent holding a university degree compared to 19 percent of immigrant men in 2019–23.
Figure 17. Educational Attainment of Immigrant Workers (ages 18 to 64) in Napa County, by Gender, 2019–23
Educational patterns also varied by workers’ legal status. MPI estimates that in 2023, nearly half of unauthorized immigrant workers and of lawfully present noncitizen workers did not have a high school diploma (see Figure 18). In comparison, the share of naturalized U.S.-citizen workers without a high school diploma was lower, at 28 percent (but still much higher than among U.S.-born workers: 6 percent).
Relatedly, the share of U.S.-born Napa County workers with a university degree was 47 percent in 2023, significantly higher than among workers who were naturalized U.S. citizens (33 percent) and lawfully present noncitizens (22 percent). (The sample of unauthorized immigrant workers with a university degree was not large enough to generate a reliable estimate.)
Figure 18. Share of Workers (ages 16 to 64) with Less than a High School Diploma, by Nativity and Legal Status, 2023
4. Economic Contributions of Immigrant Workers in the Wine and Hospitality Industry
California’s wine industry has, since its early days, relied heavily on fieldworkers, as wine production and quality depend on timely and attentive vineyard management practices at various points in the year, including at harvest (see Box 2). This multiracial, disproportionately foreign-born workforce has over the decades included Native Americans, Mexican-Californios, and immigrants from countries ranging from China to Germany.24 Immigration policies throughout U.S. history, including the 1882 Chinese Exclusion Act and the Immigration Act of 1924, have shaped the labor force in Napa County and California more broadly. For example, Chinese immigrants made up 80 percent of the agricultural labor force in Sonoma Valley vineyards in the 1880s, before the Chinese Exclusion Act abruptly halted immigration from China.25 Then in 1942, the enactment of the Emergency Labor Program, or Bracero Program, facilitated the migration of Mexican laborers in the wine industry—a policy that by the early 20th century led to a California wine industry labor force predominantly composed of Mexican and Mexican American workers.26
"Immigration policies throughout U.S. history ... have shaped the labor force in Napa County and California more broadly."
Beginning in 1942 and continuing through 1964, more than 1.5 million Mexicans worked legally in the U.S. agriculture industry as part of the Bracero Program.27 Alongside those employed and working legally, unauthorized immigration surged, prompting government efforts in the 1950s to remove Mexican unauthorized immigrants from the United States—including 1.1 million in 1954 alone. The federal government continued to push farms to hire authorized Bracero workers, and admissions peaked at 445,000 in 1956. By 1962, 68 percent of all Braceros were working on California farms.28 While the Bracero Program ended in 1964, it set the stage for continued employer demand for Mexican agricultural labor and for future temporary work programs such as the H-2A visa.
Box 2. Types of Jobs in California’s Wine Industry
Since the 1870s, California’s wine industry has relied to varying degrees on an immigrant labor force in all aspects of vineyard work, from clearing and planting the land, to making the wine and serving as vineyard managers. Many tasks performed by fieldworkers—including digging, pruning vines, and picking grapes—are physically demanding. Some also carry health risks such as repetitive-strain injuries, chemical and pesticide exposure, respiratory and allergic conditions, confined-space hazards, and more. These physically demanding forms of labor offered median annual wages of $44,680 in 2024.
Professional roles within a winery—including lead and assistant winemakers, vineyard managers, cellar masters, and tasting-room managers—require varying levels of education and expertise. For example, winemakers typically hold a master’s degree in viticulture and oversee grape ripeness, vine health, wine chemistry, and regulatory compliance, earning well into the six figures. Cellar masters generally have a bachelor’s degree or sommelier certification and prior experience, supervise day-to-day winery operations such as safety and maintenance, and earn a high-five-figure salary.
Despite the range of professional opportunities, most workers involved in wine production are fieldworkers. Napa County offers working conditions that are relatively good compared to industry standards: fieldworkers have some of the highest wages in California, and many benefit from employer-sponsored health insurance and retirement savings programs. The county has also invested in farmworker training and retention and in local partnerships that aim to help workers access safe and affordable housing.
Sources: Julie Zigoris, “The Chinese Roots of Northern California’s Wine Industry Run Deep,” KQED, September 29, 2025; Michelle Risser, “Careers in Winemaking: Roles to Explore,” University of California Davis School of Law, June 9, 2023; Jess Lander, “Napa’s Vineyard Workers Are Retiring—and the Next Generation Doesn’t Want Their Jobs,” San Francisco Chronicle, July 27, 2022; Sami Youakim, “Occupational Health Risks of Wine Industry Workers,” British Columbia Medical Journal 48, no. 8 (2006): 386–391; Keith Wallace, “Wine Jobs,” Vinology, accessed December 10, 2025; U.S. Bureau of Labor Statistics, “Occupational Employment and Wage Statistics Query System,” updated May 2024; Napa Valley Vintners, “Commitment to Farmworkers,” accessed February 4, 2026; Napa County Department of Housing and Homelessness Services, 2024 Napa County Farmworker Housing Needs and Impact Health Assessment (Napa, CA: Napa County Department of Housing and Homelessness Services, 2024).
Understanding Immigrant Workers’ Contributions and the Potential Impacts of High Immigration Enforcement: A Simulation
Since January 2025, President Donald Trump’s second administration has rapidly expanded operations to arrest, detain, and deport unauthorized immigrants, and to push others to depart on their own, or “self-deport,” through incentives or fear. In immigrant-dense industries, this heightened immigration enforcement has raised concerns about employers’ ability to meet labor needs, particularly as the government has also narrowed lawful immigration opportunities.29
To explore the impact immigrant workers have on the Napa County wine and hospitality industry, MPI researchers modeled scenarios in which subsets of this workforce were removed entirely from the local labor market: first, foreign-born workers of all statuses, and then unauthorized immigrants specifically. Wine and hospitality jobs go beyond farmwork and intersect with a range of other professions and industries, spanning viticulture, winery operations, manufacturing, hospitality, and tourism.30 For the purposes of this exercise, MPI researchers considered all jobs in agriculture, manufacturing, and food and accommodations as a proxy for the county’s wine and hospitality industry (see Box 3 and Table A–1 of the Appendix for details). Using multiple large, nationally representative datasets, described in the Appendix, and 2023 MPI estimates of the unauthorized immigrant population, the researchers used the input-output economic modeling software IMPLAN to measure how cutting certain immigrants’ jobs would affect the overall number of jobs, industry output, GDP, and tax revenues in Napa County. While hypothetical, dollar estimates produced by this analysis illustrate the links between immigrant workers and various aspects of the county’s economy.
Box 3. The Definition of the Wine and Hospitality Industry in this Analysis
Due to differences between the ACS microdata used in earlier sections of this report and the macroeconomic variables built into the IMPLAN software, MPI researchers utilized a different set of definitions to build a proxy for Napa County’s wine and hospitality industry for the simulation. To represent agriculture, manufacturing, and hospitality, the researchers combined six IMPLAN-defined industries: 1) wineries (including agricultural and manufacturing activities); 2) hotels, motels, and casinos; 3) other accommodations (including for tourism); 4) full-service restaurants; 5) limited-service restaurants; and 6) all other food and drinking places. IMPLAN industries are based on the North American Industry Classification System (NAICS). For instance, IMPLAN’s wineries category is an aggregate of 21 NAICS business activities in grape farming and/or manufacturing for the purposes of making wine, brandies, and other liquors from grapes and other fruits. A full description of variables, datasets, key assumptions, and limitations of IMPLAN’s input-output method can be found in the Appendix of this report.
Simulation Results: Employment, GDP, and Other Economic Impacts
Based on IMPLAN’s data library, in 2023, there were close to 26,000 workers in Napa County’s wine and hospitality industry, as defined in Box 3, and the industry generated $9.6 billion in gross sales (total industry output). After subtracting the value of the intermediate inputs to production (which include raw materials, equipment, labor, and other resources used in production), the industry contributed $5.1 billion to the county’s total GDP (which was $14.1 billion in 2023) and generated $1.2 billion in combined tax revenues at the federal, state, county, and subcounty levels.
To quantify the economic contributions of immigrants of all statuses to the county’s wine and hospitality industry, MPI researchers modeled a scenario in which all immigrants were removed from the industry workforce. The results show that, based on 2023 data, immigrant workers held about 10,690 jobs in the wine and hospitality industry, which generated $2.7 billion in gross sales for the industry annually. In terms of the value added to the local economy, these immigrant workers’ total contributions amounted to close to $1.5 billion, equivalent to 11 percent of the county’s GDP (with GDP being final sales minus the costs of the intermediate inputs to production; see the Appendix for details). By comparison, the 2012 MPI report, which used 2009 data, gave a lower-bound estimate for immigrants’ contribution to the county’s GDP of $317 million and an upper-bound estimate of $1.07 billion.31
"In terms of the value added to the local economy, these immigrant workers’ total contributions amounted to close to $1.5 billion, equivalent to 11 percent of the county’s GDP."
In light of the current immigration policy environment, this study’s second scenario focuses specifically on unauthorized immigrant workers. In this simulation, due to widespread immigration enforcement operations, all unauthorized immigrant workers’ jobs in the wine and hospitality sector are eliminated—equivalent to 3,350 jobs, according to MPI estimates (see the Appendix for details). It is hypothesized that these workers cannot be replaced, at least in the short run. The industry is already struggling to recruit a new generation of workers: the average age of a California farmworker has risen from 30 in the 1970s to 40 today, and it is not uncommon for Napa County farmworkers to work well into their 60s.32 Farmwork is often seen as less desirable because of its seasonality, low wages, and hard physical labor. Thus, if all unauthorized immigrant workers were to be removed from the workforce over a short period through high immigration enforcement, recruiting enough U.S.-born or lawfully present immigrant workers to replace them would be challenging.
The simulation indicates that these job losses in the wine and hospitality industry would have ripple effects across various sectors in the Napa County economy. Because wine and hospitality jobs are strong economic drivers, close to 1,200 additional jobs held by a mix of U.S.-born and immigrant workers would be lost, primarily jobs in fruit farming (the category that encompasses grape growing), followed in smaller numbers by jobs in support activities in agriculture and services such as real estate and insurance. In sum, other workers—both native and foreign born—would lose their jobs, beyond the unauthorized immigrant workers targeted by immigration enforcement operations.
Lost jobs and lost wages throughout the economy would reduce households’ collective disposable income by $208 million, according to the simulation, which would dampen demand for goods and services in Napa County. However, a share of that disposable income would not have been destined for Napa County’s economy in any case, given that 38 percent of immigrant workers are commuters33 who may have spent their take-home pay in their county of residence or sent remittances to family and friends in their home countries.
Accounting for multiplier effects throughout the economy, it is estimated that the wine and hospitality industry’s output (gross sales) would drop by $1 billion if it were to lose all its unauthorized immigrant workers. To put this in context, this loss would be equivalent to 11 percent of the industry’s total production in 2023. Another way to measure these workers’ economic impact is to consider their contribution to the county GDP, which accounts for final sales and removes the costs of intermediate inputs to production.34 The total value added to the local economy that can be either directly attributed to unauthorized immigrant workers (that is, via their labor) or indirectly (via multiplier effects of their work on other sectors and local spending) amounts to $366 million, or 3 percent of the county GDP in 2023. The indirect effects of these workers’ removal would lead to production output losses in linked industries, namely fruit farming (grape growing), wholesale packaging, warehousing and manufacturing (glass and wood components), trucking, and insurance services (see Table 9). Additional details on these estimates can be found in the Appendix.
Table 9. Simulation Results: Estimated Change in Output for the Top 15 Industries in Napa County That Would Be Affected by Unauthorized Immigrant Workers’ Removal
|
|
Sectors |
Change in Industry Output |
|---|---|---|
|
1 |
All other food and drinking places |
-12% |
|
2 |
Limited-service restaurants |
-11% |
|
3 |
Full-service restaurants |
-11% |
|
4 |
Wineries |
-11% |
|
5 |
Other accommodations |
-11% |
|
6 |
Hotels and motels, including casino hotels |
-10% |
|
7 |
Fruit farming |
-9% |
|
8 |
Wholesale - Grocery and related product wholesalers |
-7% |
|
9 |
Insurance agencies, brokerages, and related activities |
-6% |
|
10 |
Warehousing and storage |
-6% |
|
11 |
Glass container manufacturing |
-5% |
|
12 |
Wholesale - Machinery, equipment, and supplies |
-5% |
|
13 |
All other miscellaneous wood product manufacturing |
-4% |
|
14 |
Truck transportation |
-4% |
|
15 |
Lessors of nonfinancial intangible assets |
-4% |
Unauthorized immigrant workers and their families also contribute directly and indirectly to tax revenues, including as consumers, property owners, and renters. Even under this simulation’s assumption that unauthorized immigrants do not contribute to federal and state payroll taxes (which is not true for all members of this population35), the model indicates that removing all unauthorized immigrant workers from the wine and hospitality industry in Napa County would depress tax revenues by about 10 percent. Altogether, Napa County’s government and its subcounty authorities would lose slightly more than $28 million annually due to lower revenues from property, sales, and special assessment taxes (see Figure 19).
Figure 19. Simulation Results: Estimated Annual Loss of Tax Revenues by Napa County’s Government and Subcounty Authorities If All Unauthorized Immigrant Workers Were to Be Removed
High-Enforcement Immigration Policies and Economic Downturn
The results of this economic simulation are clear: If the federal government were to achieve the Trump administration’s stated goal of removing all unauthorized immigrants from the United States, the loss of these workers would have a serious impact on economies such as Napa County’s that are specialized and highly reliant on immigrant labor. Importantly, job losses in the wine and hospitality industry would spread to other sectors and affect other workers, including U.S.-born and lawfully present immigrant workers. This is due to the strong linkages between the wine and hospitality industry and sectors such as wholesale trade, transportation, and real estate, among others.
The economic impacts presented here could be considered a minimum effect since there are some reasons to believe this model underestimates the employment, household income, and GDP outcomes of this scenario. First, research has long found that nationally representative datasets such as the ACS undercount farmworkers.36 Such datasets are the basis for several MPI population estimates used in this analysis as well as the IMPLAN datasets used for the simulation. In addition, MPI estimates of the unauthorized immigrant share of workers in the wine and hospitality industry are conservative when compared to other sources’ estimates for agriculture workers in general (see the Appendix for details).
Second, the ripple effects on workers in other industries are hard to predict but could be greater than suggested by this simulation. Other than an initial drop of household income, the model does not account for possible changes in job-seeking, or in the savings and investment patterns of lawfully present immigrants and U.S. citizens in mixed-status households (recall that nearly 10,000 Napa County residents with a legal status lived with at least one unauthorized immigrant in 2023, according to the MPI estimates in Table 6). One analysis of California’s workforce attributes most of the 447,000 drop in private-sector jobs between May and September 2025 to increased immigration enforcement that summer.37 Though the decline in employment was greater among noncitizens, the overall decline in jobs signals a negative spillover effect on workers and businesses beyond those targeted. Such an effect could, in turn, further reduce employment levels and disrupt demand for goods and services (especially housing), resulting in downward pressure on Napa County’s GDP and tax revenues.
When considering the simulation results against the backdrop of sharply increased immigration enforcement under the second Trump administration, there are several wildcards. Trump has at times carved out exceptions for agricultural workers, recognizing their importance to farmers and the U.S. food chain,38 and Napa County’s unique position as the crown jewel of U.S. wine country may serve as an additional protective factor. Moreover, unauthorized immigrant workers, businesses, and community organizations may be far more resilient than this model assumes. While enforcement-related uncertainty could remain an issue, local stakeholders may develop strategies to minimize job vacancies.
In an even more conservative scenario, one in which only half of unauthorized immigrant workers in Napa County’s wine and hospitality industry are forced out of their jobs, businesses would still lose tens of millions of dollars in production output, and county and subcounty tax revenues would still fall significantly. These findings point to the profound effects that immigration enforcement, even if more modest, could have on Napa County’s economy, given the importance of maintaining a reliable and skilled workforce, the outsized role of immigrant workers, and the existing decline in the foreign-born population.
5. Conclusion
A long history of immigration to Napa County has been vital for its communities and its workforce. Over the years, immigrants have settled down, and many U.S.-born residents are descendants of immigrants. About 92 percent of immigrants in Napa County had been in the United States for at least ten years as of 2019–23, and a rising share are naturalized U.S. citizens (48 percent in 2023, up from 30 percent in 2006–08). In addition, close to half of all Napa children had at least one immigrant parent in 2019–23.
Immigrant families have also been a driving force in the county economy. Though the foreign-born share of workers in Napa County decreased slightly over the past decade, immigrants remain a notable presence across a variety of industries—from agriculture to health care. Napa County’s immigrants are also far more likely than the U.S. born to be of working age (18 to 64): 71 percent versus 46 percent in 2019–23. Combined, immigrants and U.S.-born Latinos made up nearly half of all workers in the county.
Nonetheless, some immigrants continue to face barriers to integration. Half of immigrants in Napa County had limited English proficiency in 2019–23, and large shares of working immigrant men (39 percent) and women (29 percent) had less than a high school diploma. Across industries, immigrants’ earnings were relatively low, despite being more likely than the U.S. born to work full time, year round. And while the overall immigrant population has high health insurance coverage rates, low-income immigrant families’ already-limited access to health and other public benefits will likely have shrunk further, given that the data in this profile were collected prior to policy changes under the 2025 One Big Beautiful Bill Act.
A decade-long rise in the cost of living, and especially of home prices, in Napa County is undoubtedly a factor in the demographic changes highlighted in this report. A growing share of people who work in the county, both U.S. and foreign born, commute in from other areas. And while close to 60 percent of immigrants lived in owned homes, this is a more attainable dream for some than others. For example, higher shares of Latinos (immigrant and U.S. born alike) were low income than non-Latinos.
Napa County’s heavy reliance on immigrant labor in the wine and hospitality industry, particularly for crucial roles in vineyards, will be front of mind as communities experience increased immigration enforcement and as legal admissions channels are narrowed. The economic impact analysis conducted for this study found that foreign-born workers (of all statuses) in the wine and hospitality industry contribute as much as $1.5 billion to local GDP through their direct labor in that industry and its multiplying effect throughout the economy. Removing unauthorized immigrant workers from the wine and hospitality industry would shrink Napa County’s GDP by 3 percent and local tax revenues by 10 percent, while also reducing the number of jobs in several related industries, affecting U.S.-born and lawfully present noncitizen workers as well. Such impacts would add to challenges already facing the region’s signature industry, ranging from its aging workforce to reduced global demand for wine and damaging climate events.
"Napa County’s heavy reliance on immigrant labor in the wine and hospitality industry, particularly for crucial roles in vineyards, will be front of mind as communities experience increased immigration enforcement and as legal admissions channels are narrowed."
These and other insights from this report suggest a number of ways policymakers and organizations working closely with the county’s immigrants can further strengthen their contributions to the regional economy and support their integration into local communities. Some key recommendations include:
- Naturalization assistance. As the county’s immigrants have spent more time in the United States and put down roots, many have become U.S. citizens—some likely encouraged by past naturalization campaigns. Renewed efforts targeting eligible-to-naturalize individuals who have not yet done so would further their full participation in Napa County society. Data suggest these campaigns should focus in particular on Latino immigrants, who make up approximately two-thirds of immigrants who have been in the country for more than a decade. There may also be opportunities to collaborate with neighboring counties in which some of Napa County’s immigrant workers reside.
- Legal assistance. While approximately three-fourths of immigrants in Napa County had some form of legal status in 2023, lawful immigration pathways have become narrower during the second Trump term. Legal assistance is thus more important than ever to immigrants’ ability to understand and navigate the complex U.S. immigration system. These services could target immigrants ranging from asylum seekers and TPS holders to workers on H-1B visas, all categories that have faced uncertainty amid Trump administration efforts to cut back these categories.
- Language assistance. English proficiency is a necessary skill for immigrant adults to better access economic opportunities for themselves, as well as for immigrant parents of U.S.-born children to support their access to resources and meaningful social participation. As such, sustained support for adult English learning opportunities constitutes an investment not only in the workforce of today but also tomorrow.
- Adult basic education and postsecondary credential programs. The data in this report highlight important gaps in immigrants’ educational attainment. Immigrant adults with lower levels of education, including those who are already working, could benefit from educational support tailored to the practical realities of balancing education with work and family obligations.
- Family health and related services access. With health insurance coverage rates above the statewide average, many Napa County immigrants have support in accessing the care they need. However, low-income immigrants are likely to see more restricted access to health and nutrition programs under the One Big Beautiful Bill Act. Immigrants’ benefits use will be further constrained by new guidance on how accessing such programs can affect one’s future immigration prospects (the public-charge rule) and by federal agencies’ efforts to redefine eligibility for bedrock child welfare programs such as Head Start. Taken together, these changes are likely to lead some immigrant families to seek local alternatives such as food banks, donations, and community resources.
- Studying the role the descendants of immigrants play in the county’s communities and workforce. Both this study and MPI’s 2012 report on Napa County39 have focused on first-generation immigrants. But these analyses have also recognized that the growth in the county’s U.S.-born population is powered to a notable extent by the children and further descendants of immigrants. Future research should examine the socioeconomic outcomes of these U.S.-born descendants, especially the second generation, to build understanding of their successes and challenges in thriving in Napa County.
This profile of the immigrants who live and work in Napa County could serve as a launching pad for broader conversations on how immigration and immigrant integration policies intersect with issues ranging from the high cost of living pushing workers out of the county, to stagnating population growth, to the global demand and supply-side issues facing the wine industry. As Napa County’s policymakers navigate these realities, immigrant communities and the organizations that work closely with them should be an integral part of the county’s development plans.
"As Napa County’s policymakers navigate these realities, immigrant communities and the organizations that work closely with them should be an integral part of the county’s development plans."
Appendix. About the Economic Impact Simulations
The IMPLAN input-output modeling technique used to produce the estimates in Section 4 of this report is based on macroeconomic variables, unlike the microdata from the American Community Survey (ACS) used in many parts of Sections 2 and 3 to establish a profile of immigrants in Napa County. The IMPLAN software’s data library pulls from multiple large, nationally representative datasets. Most manufacturing sector data come from the U.S. Census Bureau’s Annual Survey of Manufactures, and data on the services industries are largely from the Bureau of Economic Analysis’s Annual Industry Accounts.
For county-level farm output—a key facet of the simulations in this report—IMPLAN data come from the U.S. Department of Agriculture’s National Agricultural Statistics Service - Value of Production and Economic Research Service Cash Receipts. The software distributed state values to counties based on a formula taking into account the states’ physical production from the latest Census of Agriculture.40
Employment-related variables, such as job numbers and wages paid to employees, come from the U.S. Bureau of Labor Statistics’ Quarterly Census on Employment and Wages. This dataset covers about 95 percent of jobs, but there are limitations to how well the agricultural sector is captured due to the high prevalence of self-employment.41
Industry Definitions
The wine and hospitality industry, as defined in Section 4 of this report, combines six IMPLAN-defined industries that, in the context of Napa County, capture most business activities related to agriculture (grape farming), wine manufacturing, and hospitality (wine tourism). Table A–1 shows the overlap between MPI categories, IMPLAN industries, and selected relevant North American Industry Classification System (NAICS) business activities they cover.
Table A–1. Wine and Hospitality Industry Definitions for Economic Impact Simulation
|
MPI Categories Linked to Wine Production |
IMPLAN Industries |
NAICS 6-Digit Codes and Selected Relevant Business Types |
|---|---|---|
|
Agriculture
Manufacturing |
Wineries | 312130 Wineries: Alcoholic beverages, brandy, distilling; applejack distilling; beverages, wines and brandies, manufacturing; blending brandy; blending wines; brandy distilling; champagne method sparkling wine, manufacturing; cider, alcoholic, manufacturing; distilling brandy; fortified wines manufacturing; grape farming and making wine; ice wine; wines manufacturing; etc. |
| Hospitality | Hotels and motels, including casino hotels |
721110 Hotels (Except Casino Hotels) and Motels: Hotel management services (i.e., providing management and operating staff to run hotels); hotels (except casino hotels); hotels (except casino hotels) with golf courses, tennis courts, and/or other health spa facilities (i.e., resorts); hotels, membership; hotels, resort, without casinos; hotels, seasonal, without casinos; etc. 721120 Casino Hotels: Casino hotels; hotels, casino; hotels, resort, with casinos; etc. |
| Other accommodations |
721191 Bed-and-Breakfast Inns 721199 All Other Traveler Accommodation 721211 RV (Recreational Vehicle) Parks and Campgrounds 721214 Recreational and Vacation Camps (Except Campgrounds) 721310 Rooming and Boarding Houses, Dormitories, and Workers' Camps Bed and breakfast inns; inns, bed and breakfast; cabins, housekeeping; cottages, housekeeping; guest houses; hostels; housekeeping cabins; tourist courts; tourist homes; guest ranches with accommodation facilities; trail riding camps with accommodation facilities; migrant workers’ camps; off campus dormitories; residence clubs, organizational; residential clubs; rooming and boarding houses; workers’ camps; workers’ dormitories; etc. |
|
| Full-service restaurants | 722511 Full-Service Restaurants: Bagel shops, full service; brew pub restaurants, primarily serving meals, full service; diners, full service; family restaurants, full service; fine dining restaurants, full service; full-service restaurants; pizzerias, full service; steak houses, full service; etc. | |
| Limited-service restaurants | 722513 Limited-Service Restaurants: Cafes, limited service; carryout restaurants; delicatessen restaurants; diners, limited service; drive-in restaurants; family restaurants, limited service; fast casual restaurants; fast-food restaurants; pizza delivery shops; restaurants, fast food; sandwich shops, limited service; takeout eating places; etc. | |
| All other food and drinking places |
722310 Food Service Contractors 722320 Caterers 722330 Mobile Food Services 722410 Drinking Places (Alcoholic Beverages) 722514 Cafeterias, Grill Buffets, and Buffets 722515 Snack and Nonalcoholic Beverage Bars Food concession contractors (e.g., convention facilities, entertainment facilities, sporting facilities); banquet halls with catering staff; bartender services including supply of equipment and alcohol; bartender services on own account (serving only); caterers; catering services, social; food carts and trucks, mobile; food concession stands, mobile; alcoholic beverage drinking places; bars (i.e., drinking places), alcoholic beverage; brew pubs, primarily serving alcoholic beverages for immediate consumption; cocktail lounges; discotheques, alcoholic beverage; drinking places (i.e., bars, lounges, taverns), alcoholic; lounges, cocktail; nightclubs, alcoholic beverage; tap rooms (i.e., drinking places); taverns (i.e., drinking places); etc. |
Based on IMPLAN’s data library, there were 26,000 workers in the wine and hospitality industry of Napa County, which directly sustained 24 percent of all jobs in the county, in 2023. The wine and hospitality industry—as defined in the simulations—had a total production (or output measured as gross sales or revenues) of $9.6 billion in 2023. After removing the cost of intermediate inputs to production, the true value added by the wine and hospitality industry to Napa County’s GDP was $5.1 billion, roughly 36 percent of total GDP ($14.1 billion) in 2023. The wine and hospitality industry is thus clearly among the leading sectors in the local economy. By some measures, these estimates of the wine and hospitality industry may seem conservative, but this baseline scenario only takes into account employment and output from the six IMPLAN sectors that were combined to create the wine and hospitality industry for this analysis. Other parts of the Napa County economy that are linked to the wine and hospitality industry and could feel the knock-on effects of changes to its workforce are discussed in Section 4.
Data on Immigrant Workers and Their Economic Characteristics
Though microdata could not be used directly in the IMPLAN model, MPI researchers drew from their analysis of ACS microdata to determine some of the key values that framed the simulations. For the benchmark scenario examining the economic impact of all immigrant workers, the immigrant share of all jobs in the wine and hospitality industry was taken to be 34 percent. Importantly, the researchers used such data and MPI’s unique methodology for assigning legal status in U.S. Census Bureau data42 to estimate the unauthorized immigrant share of all workers in the county’s wine and hospitality industry: 14 percent as of 2023. This estimate should not to be confused with the unauthorized immigrant share of workers in the agricultural industry alone, which is likely much higher; by some estimates, it ranges from 40 percent to 50 percent in California.43 Though large numbers of unauthorized immigrants are known to work in the manufacturing and hospitality sectors, the total number of workers in these sectors is very high and, as a result, the unauthorized immigrant share of all workers is lower.
Likewise, the immigrant shares of total wage income, household spending, and commuters all came from MPI analysis of ACS data. Note that to ensure consistency with the data profile presented in the report, events and impacts simulated in IMPLAN occur in the year 2023, but they are expressed in 2026 dollars.
One drawback of the macro variables available in IMPLAN is that they do not distinguish between native- and foreign-born workers, nor by immigrants of different legal statuses. To make up for this, MPI researchers used 2019–23 ACS data with MPI legal status estimates. For example, in the second simulation, the researchers used 2019–23 ACS data with MPI legal status estimates to compute the share of all wine and hospitality industry jobs held by unauthorized immigrant workers in 2023 (14 percent). Next, the researchers adjusted IMPLAN model variables on employee compensation and household income by applying an immigrant-native earnings ratio to reflect the lower earnings of unauthorized immigrant workers. There was an immigrant-native earnings ratio of 77 percent in the agriculture, manufacturing, and hospitality industries combined. For the simulation focused on unauthorized immigrants, it was set slightly lower at 74 percent. This proxy ratio likely overestimates the earnings of unauthorized immigrant workers, though it is difficult to estimate by how much. The effect of this earnings adjustment is that a reduction in the number of workers generates a less-than-proportional loss in workers’ compensation paid out by employers. And in turn, worker compensation is, in theory, a reflection of worker productivity. For example, losing 100 immigrant workers would reduce the firm’s output by the equivalent of 77 employees’ output, instead of 100.
Unauthorized Immigrant Workers: Simulation Assumptions and Results
The IMPLAN data show that in 2023, total employee compensation for workers in the wine and hospitality industry in Napa County was about $2 billion. Job losses should thus be accompanied by a drop in household spending that reflects the loss of income by the workers directly affected. To determine the loss of disposable household income available for spending in the county in the simulation focused on unauthorized immigrants, a few assumptions were made, including:
- The loss of employee compensation (wages paid out by employers) is adjusted to reflect the share of workers who are unauthorized immigrants, and their lower earnings, as described above.
- Unauthorized immigrant workers are assumed not to pay payroll taxes. In practice, however, some unauthorized immigrant workers do pay payroll taxes, either through direct withholdings by their employer for social programs these immigrants are not eligible for such as Medicare and Social Security or because the workers file taxes through an Individual Tax Identification Number (ITIN).44 For the purposes of the simulation, the researchers ignored those payments because 1) these transfers are largely for the federal and state governments,45 unlike the study’s focus on county-level effects, and 2) there is limited information on the share of unauthorized immigrants subject to payroll taxes and the share who file taxes. The impact of this assumption is that the model may overestimate the take-home pay of unauthorized immigrant workers, but the downwards wage adjustment described above likely corrects for some of that bias.
- Unauthorized immigrant workers are assumed to send 15 percent of their income in remittances, a level consistent with evidence on immigrant spending and a similar assumption made in the earlier MPI report on Napa County.46
- Unauthorized immigrant workers’ earnings are assumed to be concentrated in the $50,000–$75,000 bracket, a required input in IMPLAN and consistent with ACS data from 2019–23.
- Unauthorized immigrant workers who commute into the county are assumed not to spend their income in the county. (This report’s data analysis showed that 38 percent of all immigrants working in Napa County [not unauthorized immigrants specifically] lived outside the county in 2019–23.) The assumption that commuters do not spend any money in the county where they work is a strong but necessary input built into IMPLAN’s economic impact model.
Accounting for all the assumptions and adjustments described, the sequence of events simulated is the following: First, all unauthorized immigrant workers (14 percent of all workers) are removed from the wine and hospitality industry, such that 3,350 jobs are cut across the six relevant IMPLAN sectors. This is accompanied by a 10-percent drop in the production of the industry (a less-than-proportional loss for the number of workers, as explained above).
The economic impacts on employment levels and the county’s GDP, described in Section 4 of the report, are derived from the input-output model (see Table A–2). In sum, the simulation shows that the 3,350 unauthorized immigrant workers added about $366 million to the local economy, of which $253 million was as a direct effect of their labor and more than $113 million through indirect and induced effects of their work; this includes the creation of jobs in other linked sectors and economic activity generated in the overall economy by their spending.
Table A–2. Simulation Results: Summary of Economic Impacts of Removing Unauthorized Immigrant Workers from Napa County’s Wine and Hospitality Industry
|
Effects |
Employment (jobs) |
Industry Output (gross sales or revenues) |
Value Added to County GDP |
|---|---|---|---|
| 1 - Direct |
-3,350 |
-$781,635,076 |
-$252,727,610 |
| 2 - Indirect |
-587 |
-$170,435,045 |
-$61,754,502 |
| 3 - Induced |
-408 |
-$55,671,098 |
-$51,314,284 |
| Total Effects |
-4,344 |
-$1,007,741,218 |
-$365,796,396 |
All Immigrant Workers: Simulation Assumptions and Results
The benchmark scenario looking at the economic impact of all immigrants in the wine and hospitality industry used assumptions that in some cases were different to those used in the scenario focused on unauthorized immigrants. The main point of difference was the calculation of payroll taxes: it is assumed that immigrant workers with a legal status incurred an 8.75 percent payroll tax rate.47 These taxes are withheld from employees’ paychecks and include Medicare (1.45 percent), Social Security (6.2 percent), and California’s State Disability Insurance (1.1 percent). Federal and state income taxes, which are separately deducted from paychecks, were not accounted for as they depend on filer status (married, single, number of children, and various possibilities for deductions). Because of the assumption, described above, that unauthorized immigrants did not pay such taxes, this broader scenario assumes that 67 percent of all immigrant workers (those with a legal status) paid payroll taxes. As in the other scenario, workers’ income bracket was $50,000–$75,000; increasing the range to $70,000–$100,000 for this all-immigrants scenario did not materially change the results.
Based on IMPLAN data, the total number of jobs held by immigrant workers in the wine and hospitality industry was 10,690 in 2023. Due to multiplier effects, cutting all of these immigrant jobs would cause an additional 4,220 jobs to be lost in other sectors (see Table A–3). Accounting for direct, indirect, and induced effects, the loss of all foreign-born workers in the wine and hospitality industry would result in a $2.7 billion loss in the industry’s gross sales, which after removing the value of intermediate inputs would reduce Napa County’s GDP by $1.5 billion (equivalent to 11 percent of the county’s GDP in 2023).
Table A–3. Simulation Results: Summary of Economic Impacts of Removing All Immigrant Workers from Napa County’s Wine and Hospitality Industry
|
Effects |
Employment (jobs) |
Industry Output (gross sales or revenues) |
Value Added to County GDP |
|---|---|---|---|
| 1 - Direct |
-10,690 |
-$1,975,212,961 |
-$1,005,533,255 |
| 2 - Indirect |
-2,334 |
-$430,693,965 |
-$245,704,082 |
| 3 - Induced |
-1,886 |
-$339,376,425 |
-$238,448,394 |
| Total Effects |
-14,910 |
-$2,745,283,351 |
-$1,489,685,731 |
Tax Impacts
Tax impacts reported by IMPLAN are based on the input-output model results, and an analysis of inter-institutional transfers made in the county and drawn from multiple sources such as the U.S. Census Bureau’s Annual Survey of State and Local Government Finances, the Census of Government, and the Annual Survey of State Government Tax Collections. IMPLAN accounts for monetary flows between government, businesses, and households, including social insurance tax (contributions by employers and employees); corporate profit tax; taxes on production and imports net of subsidies (excise taxes, custom duty, sales tax, property tax, motor vehicle license, severance tax, other taxes, and special assessments); and five types of personal taxes paid by households (income tax, non-taxes such as fines and fees, motor vehicle license, property taxes, and other taxes such as for fishing/hunting).48
Acknowledgments
The authors are grateful to their Migration Policy Institute (MPI) colleagues Ariel G. Ruiz Soto and Julia Gelatt for their input on the development of this report, as well as for early research assistance provided by former interns Tsveta Dobreva and Emilie Folsom. The authors also appreciate MPI colleagues Lauren Shaw for her impressive editing and Michelle Mittelstadt for strategic outreach.
Napa Valley Community Foundation (NVCF) funded the creation of this report, which is an updated look at Napa County’s immigrant population that follows MPI’s 2012 publication Profile of Immigrants in Napa County, also funded by NVCF.
MPI is an independent, nonpartisan policy research organization that adheres to the highest standard of rigor and integrity in its work. All analysis, recommendations, and policy ideas advanced by MPI are solely determined by its researchers.
About the U.S. Immigration Policy Program
The U.S. Immigration Policy Program provides analysis of U.S. immigration pathways, the impacts of enforcement and other policies, and the characteristics of immigrant populations.
Notes
-
1
In this analysis, the wine and hospitality industry comprises agriculture, manufacturing, and food and accommodation services. See Section 4 and the Appendix of this report for details on the methodology used for the simulation.
-
2
Napa Valley Vintners, “Napa Valley Wineries Map,” accessed December 11, 2025.
-
3
Insel & Co., The Economic Impact of Napa County’s Wine and Grape Industry on the Economies of Napa County, California and the US (San Francisco, CA: Insel & Co, 2025).
-
4
Visit Napa Valley, “2023 Visitor Profile and Economic Impact Study Released” (press release, August 20, 2024); Insel & Co., The Economic Impact of Napa County’s Wine and Grape Industry.
-
5
Julia Ornelas-Higdon, “Deeply Rooted: Immigrants and the Hidden Histories of California’s Wine Industry,” Boom California, June 3, 2021.
-
6
Migration Policy Institute (MPI) analysis of data from the U.S. Census Bureau’s American Community Survey (ACS), pooled for 2019–23.
-
7
MPI analysis of ACS data, pooled for 2006–10 and for 2019–23.
-
8
Marisol Cuellar Mejia and Hans Johnson, “Immigrants in California” (fact sheet, Public Policy Institute of California, San Francisco, January 2025).
-
9
MPI Migration Data Hub, “U.S. Immigrant Population and Share over Time, 1850-Present,” accessed March 9, 2026.
-
10
Julia Gelatt, Ariel G. Ruiz Soto, and James D. Bachmeier, Changing Origins, Rising Numbers: Unauthorized Immigrants in the United States (Washington, DC: MPI, 2025).
-
11
Hans Johnson and Eric McGhee, “Who’s Leaving California—and Who’s Moving In?” Public Policy Institute of California, January 21, 2026. In recent years, top destination states for former California residents have been Texas, Florida, Nevada, Arizona, Washington, and Oregon. See Eric McGhee and Hans Johnson, “Where Are Californians Going When They Leave the Golden State?” Public Policy Institute of California, January 27, 2026.
-
12
Blane Bachelor, “Napa and Sonoma: Counties, Valleys, and Cities, Explained,” VinePair Inc., December 22, 2019; Visit Napa Valley, “Where Is Napa Valley?: Map of California Wine Country,” accessed December 9, 2025.
-
13
Randy Capps, Kristen McCabe, and Michael Fix, Profile of Immigrants in Napa County (Washington, DC: MPI, 2012).
-
14
MPI analysis of 2019–23 ACS data, pooled. Income data in this report are adjusted to 2023 prices using the annualized averages of consumer price indices for middle-sized metro areas in the West Census region. See CPI-West Size Class B/C in U.S. Bureau of Labor Statistics, “Consumer Price Index Overview Table – West,” accessed March 17, 2026.
-
15
U.S. Census Bureau, “Poverty Thresholds,” updated January 23, 2025.
-
16
Capps, McCabe, and Fix, Profile of Immigrants in Napa County.
-
17
U.S. Senate Budget Committee, Next to Fall: The Climate-Driven Insurance Crisis is Here – and Getting Worse (Washington, DC: U.S. Senate, 2024).
-
18
Capps, McCabe, and Fix, Profile of Immigrants in Napa County.
-
19
For instance, since 2016, California expanded access to the Medi-Cal program to youth under age 19, regardless of immigration status. See California Department of Health Care Services, “SB 75 – Medi-Cal for All Children,” accessed March 18, 2026.
-
20
Valerie Lacarte, “Immigrants and the Use of Public Benefits in the United States” (explainer, MPI, Washington, DC, 2024).
-
21
The top destinations of Napa County residents who commute out of the county were Solano County (4,500), Sonoma County (2,270), and Contra Costa County and the City and County of San Francisco (each 1,400).
-
22
MPI analysis of ACS data, pooled for 2006–10 and for 2019–23, finds that between these periods the foreign-born share of the Solano County population grew by 16 percent. This growth could be attributed to a range of factors, including birth rates, interstate and international migration, and natural disasters. The opposite population trends in Napa County, combined with housing and affordability challenges, suggest that some immigrants may be moving to more affordable neighboring counties while continuing to work in Napa County, while others may leave California entirely. See Natalie Hanson, “Exodus of Sonoma and Napa County Residents from State Has Slowed Since Pandemic, but Continues to Hamper Growth Rebound,” The Press Democrat, April 10, 2026.
-
23
U.S. Citizenship and Immigration Services (USCIS), “H-2A Employer Data Hub,” updated December 31, 2025. MPI calculated the figures in this sentence based on USCIS visa issuance data for “all petitioners,” the approach also taken in Marcos Lopez, “Ten Years of the H-2A Visa Program in California,” UC Davis School of Law, December 10, 2024. A review of H-2A visas issued statewide since 2018 shows that after a peak of 45,898 in 2022, the numbers have declined every year. Housing costs as well as changes in permanent and seasonal workforce needs are likely contributing factors; see Napa County, “Board of Supervisors Releases Comprehensive Farmworker Housing Needs & Impacts Assessment” (press release, July 23, 2024).
- 24
-
25
Julie Zigoris, “The Chinese Roots of Northern California’s Wine Industry Run Deep,” KQED, September 29, 2025.
-
26
Sarah Linn, “Rooted in Struggle: Meet Mexican Americans Working in the Wine Industry,” PBS SoCal, September 27, 2022.
-
27
Philip Martin, “Mexican Braceros and US Farm Workers,” Wilson Center, July 10, 2020.
- 28
-
29
Julia Gelatt, “Trump Restrictions on Legal Immigration Could Sharply Reduce U.S. Population Growth” (commentary, MPI, Washington, DC, April 2026).
-
30
Michelle Risser, “Careers in Winemaking: Roles to Explore,” University of California Davis School of Law, June 9, 2023.
-
31
Capps, McCabe, and Fix, Profile of Immigrants in Napa County.
-
32
Jess Lander, “Napa’s Vineyard Workers Are Retiring—and the Next Generation Doesn’t Want Their Jobs,” San Francisco Chronicle, July 27, 2022.
- 33
-
34
U.S. Bureau of Economic Analysis, “What Is Gross Output by Industry and How Does It Differ from Gross Domestic Product?,” updated October 21, 2019.
-
35
Carl Davis, Marco Guzman, and Emma Sifre, Tax Payments by Undocumented Immigrants (Washington, DC: Institute on Taxation and Economic Policy, 2024).
-
36
See, for example, Edward Kissam, “Standard Deviations: How Widening Gaps in Decennial Census and American Community Survey Response in Easy and Hard to Count Communities Lead to Inequitable Allocation of Social Program Funding,” The Census Project, April 5, 2022; William O’Hare, “2020 Census Faces Challenges in Rural America,” University of New Hampshire, December 18, 2017.
-
37
University of California Merced, Community and Labor Center, The Effects of Recent Federal Immigration Enforcement on Private Sector Employment in California and Washington, D.C. (Merced, CA: University of California Merced, Community and Labor Center, 2025).
-
38
Ximena Bustillo, “After Early Reprieve from Immigration Enforcement, Farming Industry Reckons with Raids,” NPR, June 16, 2025.
-
39
Capps, McCabe, and Fix, Profile of Immigrants in Napa County.
-
40
IMPLAN Data Team, “Industry Output Data,” updated June 27, 2017.
-
41
On the limitations of farm work variables, see IMPLAN Data Team, “Data Sources for Select Industries: Farm, Construction, Rail Transportation, and Government,” updated June 27, 2017.
-
42
MPI, “MPI Methodology for Assigning Legal Status to Noncitizen Respondents in U.S. Census Bureau Survey Data,” accessed March 15, 2025.
-
43
Research suggests that the share of farmworkers who are unauthorized immigrants ranges from 40 percent to 50 percent. For low-end estimates, see Marcelo Castillo, “Legal Status of Hired Crop Farmworkers, Fiscal 1991–2022,” U.S. Department of Agriculture, Economic Research Service, September 12, 2025. For higher estimates, see Akash Pillai et al., “Potential Implications of Immigration Restrictions on the U.S. Agricultural Workforce,” KFF, April 25, 2025; University of California, Merced, Farmworker Health in California: Health in a Time of Contagion, Drought, and Climate Change (Merced, CA: University of California, Merced, 2022).
-
44
Davis, Guzman, and Sifre, Tax Payments by Undocumented Immigrants.
-
45
The Budget Lab, The Potential Impact of IRS-ICE Data Sharing on Tax Compliance (New Haven: The Budget Lab at Yale, 2025); Sanya Bahal, “The Effect of Immigration on Social Security’s Finances,” Bipartisan Policy Center, November 14, 2024.
-
46
A report by the Inter-American Development Bank (IDB) examining remittances to Latin America and the Caribbean showed that immigrants generally send between 6 percent and 23 percent of their income in remittances to their country of origin; see IDB, “Remittances to Latin America and the Caribbean Moderate Their Growth in 2024” (news release, November 28, 2024). Research generally shows that the remittance rate among unauthorized immigrants is on the higher side. For example, the Institute on Taxation and Economic Policy uses 15 percent as the standard estimate for the portion of income unauthorized immigrants devote to remittances when calculating their tax contributions. See Davis, Guzman, and Sifre, Tax Payments by Undocumented Immigrants.
-
47
Based on a scenario of worker earning an annual wage of $60,000 in California; see SmartAsset, “California Paycheck Calculator,” accessed April 14, 2026.
-
48
IMPLAN Data Team, “Generation and Interpretation of IMPLAN’s Tax Report,” updated June 27, 2017.