Graduating into Uncertainty: Unauthorized Immigrant Students in U.S. High Schools
Related Content
Highlights
About 75,000 unauthorized immigrants graduate from U.S. high schools annually, MPI estimates. Amid immigration policy and enforcement changes, many are graduating into uncertainty.
- Drawing on mid-2023 data, MPI estimates that 90,000 unauthorized immigrant youth reach the end of high school annually, with 75,000 graduating. Texas and California alone accounted for 31 percent.
- Mexico, Honduras, Guatemala, El Salvador, and Venezuela were the top countries of origin, representing 65 percent of unauthorized immigrants nearing high school completion.
- Intensified immigration enforcement, the rescission of an ICE sensitive locations policy that had kept enforcement away from the vicinity of schools, and rising absenteeism made it harder for students to finish high school.
- With DACA closed to new entrants, several states ending in-state university tuition policies for unauthorized immigrants, and terminations of Temporary Protected Status, many high school graduates were left with limited choices.
Executive Summary
Unauthorized immigrant students approaching the end of high school today face heightened uncertainty, from stepped-up immigration enforcement to some states retreating from policies that would allow these students to pay in-state college tuition. In this period of change, this fact sheet offers Migration Policy Institute (MPI) estimates of the number of unauthorized immigrants who reach their final year of high school annually and the number who likely graduate.
Drawing on a unique methodology developed by MPI researchers in partnership with demographers at The Pennsylvania State University and Temple University for assigning legal status in U.S. Census Bureau data, MPI estimates that close to 90,000 unauthorized immigrant youth are reaching the end of high school each year. Mexico is the top country of birth for these youth (21 percent of the total), followed by Honduras, Guatemala, El Salvador, and Venezuela.
Taking into account variation in graduation rates for different student subgroups by race/ethnicity and state, MPI estimates that of the 90,000 unauthorized immigrants reaching the end of high school, about 75,000 graduate each year. Texas, California, Florida, and New York are home to about half (48 percent) of these graduates. The educational attainment and future opportunities of these unauthorized immigrant high school graduates are directly shaped by both state-level education policies and federal immigration policy and enforcement actions.
"The educational attainment and future opportunities of these unauthorized immigrant high school graduates are directly shaped by both state-level education policies and federal immigration policy and enforcement actions."
1. Introduction
For decades, the U.S. public has expressed sympathy for the situation of unauthorized immigrants who were brought to the United States as children. Most recently, more than 85 percent of respondents in a 2025 Gallup poll supported allowing Dreamers (the term now popularized for this population) the chance to become U.S. citizens if they meet certain requirements.1 Yet, most unauthorized immigrant children today have fewer options and face greater uncertainty than earlier cohorts of Dreamers as they approach the end of high school.
The Deferred Action for Childhood Arrivals (DACA) program, which has been credited with boosting college enrollment and other socioeconomic outcomes,2 is not an option for most high schoolers today. While current DACA holders can renew their status, the program has been essentially closed to new applicants since September 2017.3 And because DACA program eligibility rules state that applicants must have arrived in the United States before mid-2007, as of 2025 no one under age 18 could meet this requirement even if the program were to reopen.4 Other policies that have granted some unauthorized immigrants protection from deportation and certain other rights have been terminated or made more limited during the second Trump term, including many Temporary Protected Status (TPS) designations for nationals of countries that have experienced natural disasters, conflict, or other difficult conditions.5
Recent policy changes are also affecting some students’ ability to complete high school. Concerns related to President Donald Trump’s revocation of the “sensitive locations” policy that previously limited U.S. Immigration and Customs Enforcement (ICE) operations in schools,6 coupled with intensified immigration enforcement across the country, are having an impact on student attendance. For example, in California school districts where enforcement actions have taken place, student absences were up 22 percent on average in January–February 2025 compared to the same months in previous years.7 More recently, public schools in Durham, North Carolina, reported that more than one-quarter of students did not come to school in the wake of November immigration raids.8 Furthermore, some states may be poised to challenge the landmark Supreme Court decision Plyler v. Doe (1982) that guarantees access to K-12 public education for all children, regardless of immigration status, though no state bill has passed to date.9
For unauthorized immigrant students who do graduate from high school, some may find their postsecondary study options further limited. Since early 2025, several state policies allowing in-state tuition for unauthorized immigrants have been ended, either through actions by state legislatures (as in Florida) or as a result of a federal lawsuit (Texas and Oklahoma).10 This development has reversed a 20-year trend that started with Texas in 2001 of letting all state high school graduates, no matter their immigration status, pay in-state tuition because of the economic and workforce benefits of having a well-educated population.
Given these rapidly evolving policies and their profound impacts, understanding the number and characteristics of unauthorized immigrant children who are reaching the end of high school and graduating from K-12 schools each year is important for federal and state policymakers, educators, and community members alike. This fact sheet leverages a unique Migration Policy Institute (MPI) methodology that permits assigning legal status in U.S. Census Bureau data to shed light on this population. Since publishing a similar study in 2019, MPI researchers have refined the methodology used in this analysis; details on this approach can be found in the appendix of this fact sheet.
2. National Estimates of High School Graduates Who Are Unauthorized Immigrants
The last two decades have seen significant changes in patterns of immigration to the United States, the composition of the country’s immigrant population, and U.S. immigration and education policies. MPI estimates that approximately 13.7 million unauthorized immigrants lived in the United States as of mid-2023, up from 10.5 million in 2010.11 Over this period, the share of unauthorized immigrants from Mexico dropped, and recent arrivals came from a wider range of origins, including countries in Central America, Asia, and Africa.12 This shift in countries of origin has implications for schools, as students arrive with language backgrounds and educational experiences that are unfamiliar to educators, which can affect teachers’ ability to provide appropriate supports.
Another important trend in recent years has been rising high school graduation rates for students overall, and for certain subgroups such as Latino and English Learner students—two groups into which many unauthorized immigrants fall. National four-year high school graduation rates reached 87 percent by school year 2021–22, up from 85 percent in 2016–17, while the rate for English Learners rose from 66 percent to 72 percent.13
To understand how these immigration and education trends intersect with the unauthorized immigrant youth population, MPI estimated the average number of unauthorized immigrants who were enrolled in each high school grade (grades 9 through 12) and who were under age 22 (as some states permit high school enrollment up to age 22). This population, representing the average size of a cohort of students reaching the end of high school each year, numbered approximately 90,000. Table 1 shows the top 15 countries of birth for these students, revealing the geographic diversity of today’s unauthorized immigrant youth. The number of students from Mexico, Honduras, Guatemala, El Salvador, and Venezuela—representing 65 percent of unauthorized immigrants reaching the end of high school each year—is notable given recent immigration enforcement and other policies that have had a marked impact on these immigrant communities.
Table 1. Top 15 Countries of Birth of Unauthorized Immigrants Reaching the End of High School Annually, Mid-2023
|
|
Total |
Share |
|---|---|---|
| Total |
90,000 |
100% |
|
Mexico |
19,000 |
21% |
|
Honduras |
13,000 |
15% |
|
Guatemala |
13,000 |
14% |
|
El Salvador |
8,000 |
9% |
|
Venezuela |
5,000 |
6% |
|
Colombia |
3,000 |
3% |
|
Dominican Republic |
3,000 |
3% |
|
Philippines |
2,000 |
3% |
|
Brazil |
2,000 |
2% |
|
Haiti |
2,000 |
2% |
|
Ecuador |
1,000 |
1% |
|
Nicaragua |
1,000 |
1% |
|
Nigeria |
1,000 |
1% |
|
India |
1,000 |
1% |
|
China/Hong Kong |
1,000 |
1% |
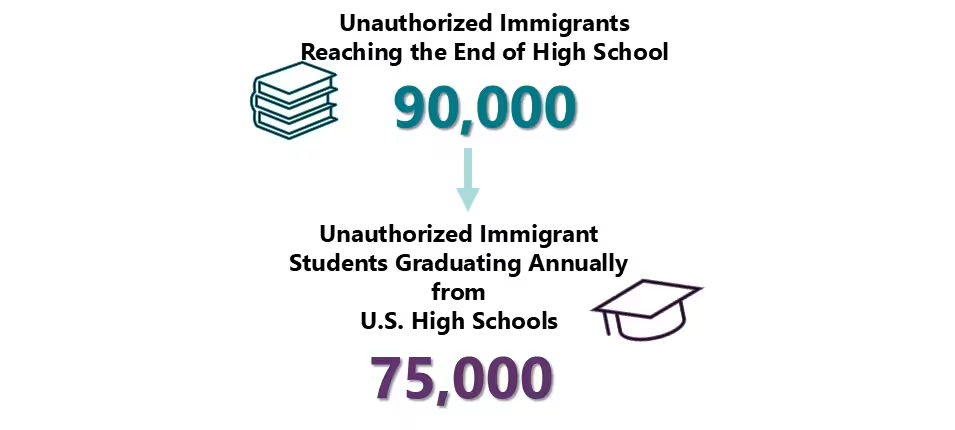
To estimate the number of unauthorized immigrant youth likely to graduate from high school each year, MPI took into account differences in graduation rates for students with different characteristics. Specifically, four-year high school graduation rates by race/ethnicity, drawn from the National Center for Education Statistics, were applied to the respective subgroups within the population of 90,000 unauthorized immigrant youth. The resulting analysis estimates that almost 75,000 unauthorized immigrant students graduate from U.S. high schools each year (see Figure 1).
Figure 1. Estimate of Number of Unauthorized Immigrants Reaching the End of High School and Those Graduating Annually
3. State Estimates of Unauthorized Immigrant Graduates
Reflecting the geographic distribution of the overall unauthorized immigrant population, high school graduates without legal status are concentrated in a handful of states (see Table 2). About 12,000 unauthorized immigrant students graduate from Texas high schools and another 11,000 from California schools every year, representing 16 percent and 15 percent of the national total, respectively. The states with the next largest numbers of graduating unauthorized immigrants are Florida (8,000 graduates), New York (4,000), and New Jersey, Maryland, Massachusetts, Virginia, Georgia, and Illinois (about 3,000 each). In total, the top 15 states shown in Table 2 account for about 81 percent of all unauthorized immigrant high school graduates each year.
These geographic concentrations mean that a relatively small number of states are responsible for supporting these youth as they complete their studies and transition to adulthood. Unlike immigration policies, which are set by the federal government, many educational policies are set and implemented at the state and local levels, including language instruction and other resources for English Learners. However, as educational funding faces looming budget pressures, states may face difficult choices in terms of education priorities. Beyond high school, as of November 2025, 22 states and the District of Columbia14 allowed unauthorized immigrant students to pay in-state tuition rates at public colleges and universities.15 Others, however, have rolled back such policies.16
Table 2. Estimated Number of Unauthorized Immigrants Who Graduate from U.S. High Schools Annually, by State, Mid-2023
|
State |
Number of Graduating Unauthorized Immigrant Students |
State Share of All Graduating Unauthorized Immigrant Students |
|---|---|---|
| United States |
75,000 |
100% |
|
Texas |
12,000 |
16% |
|
California |
11,000 |
15% |
|
Florida |
8,000 |
11% |
|
New York |
4,000 |
5% |
|
New Jersey |
3,000 |
4% |
|
Maryland |
3,000 |
4% |
|
Massachusetts |
3,000 |
4% |
|
Virginia |
3,000 |
4% |
|
Georgia |
3,000 |
3% |
|
Illinois |
3,000 |
3% |
|
North Carolina |
2,000 |
3% |
|
Washington |
2,000 |
2% |
|
Tennessee |
2,000 |
2% |
|
Pennsylvania |
1,000 |
2% |
|
Connecticut |
1,000 |
1% |
|
Other states |
14,000 |
19% |
States also vary in terms of their degree of cooperation with federal immigration enforcement actions. This may affect, for instance, students in schools that make referrals to law enforcement based on school disciplinary actions.17 Some state and local law enforcement officials actively partner with federal immigration enforcement, while other states and localities have declared themselves sanctuary jurisdictions with policies limiting cooperation with ICE.18 These decisions, like state and local education policy choices, create different environments for unauthorized immigrant students and their families, affecting their ability to persist in school and graduate.
4. Conclusion
Unauthorized immigrant students face a complex set of challenges that threatens their ability to complete high school and raises questions about what comes next after graduation. The MPI estimates presented in this fact sheet are based on the most recent data available from the U.S. Census Bureau and National Center for Education Statistics, but these mid-2023 figures predate policy changes during the second Trump term. As such, the estimated 90,000 students who reach the end of high school annually are likely to face even greater challenges to completing their education than are reflected by these data. While these students’ right to a public K-12 education is still protected under federal law, intensified immigration enforcement in communities across the country and the end of a policy barring such operations in schools have led to a rise in absenteeism and pose risks to students’ academic performance and mental health.
The 75,000 unauthorized immigrant high schoolers who graduate each year also face higher barriers today to pursuing postsecondary education or employment. With DACA unavailable and some TPS designations and other statuses being terminated, many of these graduates will lack work authorization, making them ineligible for most formal employment and professional licenses and creating a significant waste of human capital. In addition, the end of some state policies allowing all residents, regardless of immigration status, to pay in-state tuition may put college out of reach.
"Unauthorized immigrant students face a complex set of challenges that threatens their ability to complete high school and raises questions about what comes next after graduation."
Appendix. MPI Methodology for This Study
Because U.S. Census Bureau surveys do not ask respondents if they are in the country without authorization, researchers from the Migration Policy Institute (MPI), in partnership with demographers at The Pennsylvania State University and Temple University, have developed a methodology for assigning legal status to noncitizens in U.S. Census Bureau data in order to study the characteristics of the unauthorized immigrant population.19 This methodology is updated periodically as the U.S. Census Bureau releases new data and revises its own methodologies, and as immigration patterns and policies change; this is done in order to produce the most accurate estimates possible.
This fact sheet leverages that methodology, combined with additional educational data. Since publishing a similar study in 2019, which used pooled 2012–16 data from the U.S. Census Bureau’s American Community Survey (ACS),20 MPI researchers have updated the approach used in this analysis of high school students and graduates in order to refine the count of students who have ever attended U.S. high schools. Notably, the number of enrolled unauthorized immigrants reaching the end of high school in the 2012–16 period was higher than the same group in the 2019–23 ACS data used in the present fact sheet, which accounts for part of the difference in the estimates between this and 2019 fact sheet.
Estimating the Number of Students Reaching the End of High School
Applying MPI’s methodology for assigning legal status to ACS data pooled for 2019–23, the author of this fact sheet estimated the number of unauthorized immigrant students who were enrolled in high school by grade, who did not have a high school diploma, and who were under age 22 (as some states allow enrollment in high school up to age 22). The average of these students in each high school grade (grades 9 to 12) is used to estimate the number of unauthorized immigrant youth who reach their final year of high school each year: approximately 90,000 students.
Estimating the Number Graduating Each Year
The author then separated the population of 90,000 unauthorized immigrant youth by race/ethnicity using the following categories: Latino, non-Latino Asian and Pacific Islander, non-Latino Black, non-Latino White, and non-Latino other. Of the 90,000 unauthorized immigrant students reaching the end of high school each year, Latino students numbered 70,000 (or 78 percent).
Next, the author applied the most recent data available on four-year high school graduation rates, from the National Center for Education Statistics (NCES) for school year 2021–22, taking into consideration differences in graduation rates by race and ethnicity (see Table A–1).21 This was done to estimate the number of unauthorized immigrant students who are likely to graduate each year: approximately 75,000. Of them, 58,000 (or 77 percent) are Latino.
Table A–1. Estimated Number of Unauthorized Immigrants Who Graduate from U.S. High Schools Annually, by Race/Ethnicity, Mid-2023
|
Latino |
Asian and Pacific Islander |
Black |
White |
Total |
|
|---|---|---|---|---|---|
| Number of unauthorized immigrant students reaching the end of high school each year |
70,000 |
7,000 |
8,000 |
4,000 |
90,000 |
| Graduation rate |
82.8% |
93.7% |
81.0% |
89.8% |
|
| Number estimated to graduate annually |
58,000 |
7,000 |
6,000 |
4,000 |
75,000 |
State-Level Estimates
To produce state-level estimates, the author used the same approach for the 15 states with the largest unauthorized immigrant youth populations. The author used MPI’s ACS-based state-level estimates of the total number of unauthorized immigrants reaching their final year of high school each year (the average across four grades of enrolled students) and applied state-specific high school graduation rates for respective racial/ethnic student subgroups provided by NCES.22 The results are as shown in Table 2.
Acknowledgments
This research was commissioned by the Presidents’ Alliance on Higher Education and Immigration. The author thanks Miriam Feldblum, Executive Director at the Presidents’ Alliance, for her thoughtful comments and Migration Policy Institute (MPI) colleagues Lauren Shaw for her excellent edits and Michelle Mittelstadt for strategic outreach.
MPI is an independent, nonpartisan policy research organization that adheres to the highest standard of rigor and integrity in its work. All analysis, recommendations, and policy ideas advanced by MPI are solely determined by its researchers.
About the U.S. Immigration Policy Program
The U.S. Immigration Policy Program provides analysis of U.S. immigration pathways, the impacts of enforcement and other policies, and the characteristics of immigrant populations.
About the National Center on Immigrant Integration Policy
The Center is a national hub connecting policymakers, educators, community leaders, and service providers with evidence-informed policy research, technical assistance, and data to advance effective immigrant integration at U.S., state, and local levels.
Notes
-
1
Lydia Saad, “Surge in U.S. Concern about Immigration Has Abated,” Gallup, July 11, 2025.
-
2
Briana Ballis, Research Shows that DACA Benefits Both Dreamers and Their US-Born Peers (Washington, DC: Brookings Institution, 2024).
-
3
Ariel G. Ruiz Soto and Julia Gelatt, “A Shrinking Number of DACA Participants Face Yet Another Adverse Court Ruling” (short read, Migration Policy Institute, Washington, DC, September 2023).
-
4
U.S. Citizenship and Immigration Services, “Consideration of Deferred Action for Childhood Arrivals (DACA) – Frequently Asked Questions,” updated January 24, 2025.
-
5
National Immigration Forum, “Temporary Protected Status (TPS)” (fact sheet, October 6, 2025).
-
6
Lynn Damiano Pearson, “Trump’s Rescission of Protected Areas Policies Undermines Safety for All” (fact sheet, National Immigration Law Center, Los Angeles, February 26, 2025).
-
7
Thomas S. Dee, “Recent Immigration Raids Increased Student Absences” (EdWorking Paper, June 2025). This is consistent with prior research linking immigration enforcement with decreases in attendance and academic achievement and with increases in mental health issues. See, for example, J. Jacob Kirksey and Carolyn Sattin-Bajaj, “Immigration Arrests and Educational Impacts: Linking ICE Arrests to Declines in Achievement, Attendance, and School Climate and Safety in California,” American Education Research Association (AERA) Open 7 (2021); Randy Capps et al., Immigration Enforcement and the Mental Health of Latino High School Students (Washington, DC: Migration Policy Institute, 2020); Carolyn Heinrich, Mónica Hernández, and Mason Shero, “Repercussions of a Raid: Health and Education Outcomes of Children Entangled in Immigration Enforcement,” Journal of Policy Analysis and Management 42, no. 2 (Spring 2023): 350–392.
-
8
Peter O’Dowd and Will Walkey, “Durham Public School Attendance Drops to COVID Levels amid North Carolina Immigration Crackdown,” WUFT, November 21, 2025.
-
9
Ileana Najarro and Daniela Franco Brown, “Which States Are Challenging Undocumented Students’ Right to Free Education?” EdWeek, updated August 28, 2025. Lawmakers in six states have introduced legislative proposals aimed at challenging this federal law. To date, those in Idaho, Indiana, Oklahoma, and Texas have failed, the proposal in Tennessee has been paused, and the one in New Jersey in pending. In contrast, Illinois passed legislation in August 2025 protecting all students’ access to public education regardless of immigration status.
-
10
Micaela McConnell and Steven Hubbard, “The Fight over In-State Tuition for Undocumented Students,” American Immigration Council, September 19, 2025.
-
11
Julia Gelatt, Ariel G. Ruiz Soto, and James D. Bachmeier, Changing Origins, Rising Numbers: Unauthorized Immigrants in the United States (Washington, DC: Migration Policy Institute, 2025). To explore data on the unauthorized immigrant population, see Migration Policy Institute (MPI), “Unauthorized Immigrant Population Profiles,” accessed October 22, 2025. Note that MPI data on the unauthorized immigrant population include individuals who entered the country without authorization and visa overstayers, as well as individuals who hold a liminal (or “twilight”) status such as Deferred Action for Childhood Arrivals (DACA), humanitarian parole, or Temporary Protected Status (TPS) and those with a pending asylum application.
-
12
Gelatt, Ruiz Soto, and Bachmeier, Changing Origins, Rising Numbers.
-
13
National Center for Education Statistics (NCES), “Table 1. Public High School 4-Year Adjusted Cohort Graduation Rate (ACGR), by Race/Ethnicity and Selected Demographic Characteristics for the United States, the 50 States, and the District of Columbia: School Year 2016–17,” accessed October 1, 2025; NCES, “Table 219.46. Public High School 4-Year Adjusted Cohort Graduation Rate (ACGR), by Selected Student Characteristics and State or Jurisdiction: School Years 2011-12 through 2021-22,” accessed October 1, 2025.
-
14
Presidents’ Alliance on Higher Education and Immigration, “Higher Ed Immigration Portal—States,” accessed November 12, 2025.
-
15
Presidents’ Alliance on Higher Education and Immigration, “In-State Tuition and Scholarships for Undocumented Students: What Institutions Should Know,” updated September 3, 2025.
- 16
-
17
Sarah Kim Pak et al., Caught in an Educational Dragnet: How the School-to-Deportation Pipeline Harms Immigrant Youth and Youth of Color (Washington, DC: National Immigration Law Center, 2022).
-
18
Muzaffar Chishti and Kathleen Bush-Joseph, “Beyond ICE: State and Local Authorities Become Central to Trump Administration Deportations Strategy,” Migration Information Source, July 30, 2025.
-
19
For details on this methodology, see MPI, “MPI Methodology for Assigning Legal Status to Noncitizen Respondents in U.S. Census Bureau Survey Data,” accessed October 23, 2025.
-
20
Jie Zong and Jeanne Batalova, How Many Unauthorized Immigrants Graduate from U.S. High Schools Annually? (Washington, DC: MPI, 2019). This 2019 MPI study drew on a methodology first used in Jeffrey S. Passel, “Further Demographic Information Relating to the DREAM Act,” Urban Institute, October 2003.
-
21
NCES and school districts typically do not track foreign-born status in ways that permit analysis of graduation rates by nativity. As a proxy, the author used respective rates of students by race and ethnicity.
-
22
In cases when graduation rates for students identified as “other race” (including American Indian and Alaskan Native) were not available in the NCES data, graduation rates for “total” students were used. Graduation rates for “total” students in New Mexico and Oklahoma for school year (SY) 2021–22 were not available, so the author used these states’ rates from SY 2020–21.



Related Content