

Naturalized Citizens in the United States

A woman at a naturalization ceremony in California. (Photo: Freddie Everett/State Department)
Becoming a citizen is an important milestone in an immigrant’s integration and signals a formal acceptance into their new country as well as belonging and stability. With the same privileges and responsibilities as the U.S. born, naturalized citizens can vote in federal elections, access a broader range of social services and benefits, apply for jobs requiring a security clearance, sponsor parents and siblings for family reunification visas (in addition to spouses and minor children), and apply for a U.S. passport. Naturalized immigrants also have more legal protections than noncitizens and cannot be deported.
Of the 46.2 million immigrants living in the United States in 2022, 53 percent, or 24.5 million, were naturalized citizens. Approximately 878,500 immigrants became U.S. citizens in fiscal year (FY) 2023, a 9 percent decline from FY 2022 (969,400), which was the highest figure in more than a decade, and a 40 percent increase from FY 2020 (628,300; see Figure 1). The larger numbers of approved naturalization applications since FY 2020, which marked the last decade’s lowest level of naturalizations, may be the result of faster processing of the large backlogs from the COVID-19 pandemic period as well as policy changes under the Biden administration. Median processing times for naturalization applications decreased from a peak of 11.5 months in FY 2021 to five months as of May 2024. While U.S. Citizenship and Immigration Services (USCIS) raised the naturalization fee from $640 to $760 in April 2024 ($710 if submitted online), it also expanded eligibility for a 50-percent discount for applicants with household incomes under 400 percent of the federal poverty line (the poverty level for a four-person family in 2024 was $31,200) and decreased the length of the application from 20 pages to 14 pages.
Figure 1. New Naturalizations and Grants of Lawful Permanent Residence, FY 1980-2023

Sources: Migration Policy Institute (MPI) tabulation of data from U.S. Department of Homeland Security (DHS), Office of Homeland Security Statistics (OHSS), Yearbook of Immigration Statistics (Washington, DC: DHS, OHSS, various years), available online; U.S. Citizenship and Immigration Services (USCIS), “Naturalization Statistics,” updated May 9, 2024, available online; DHS, OHSS, “Legal Immigration and Adjustment of Status Report Fiscal Year 2023, Quarter 4,” updated May 5, 2024, available online.
In general, annual naturalizations follow—with a several-year delay—new grants of lawful permanent residence (also known as getting a green card). Lawful permanent residents (LPRs) must typically wait for five years (three if married to a U.S. citizen) to become eligible for naturalization. For instance, a spike in the number of new LPRs after a major legalization program in 1986 was followed by an increase in naturalizations in the mid-1990s. The number of naturalization applications has varied over time, reflecting factors such as changing eligibility rules, costs, processing backlogs, and immigrants’ personal decisions and constraints.
Not all LPRs who are eligible to naturalize do so. As of January 2023, an estimated 9 million LPRs were eligible to naturalize based on requirements such as length of residency and age, about two-thirds of whom had been in the United States for more than a decade. LPRs who come through refugee and other humanitarian channels as well as employment-based pathways are more likely to naturalize than those who come as relatives of U.S. residents.
This Spotlight provides information on new naturalized citizens in the United States, including historical trends, characteristics of naturalized citizens, and the population potentially eligible for naturalization.
Note: Yearly data on new naturalized citizens are for the federal fiscal year, which runs from October 1 through September 30 of the given year.
Click on the bullet points below for more information:
- Historical Trends
- Naturalized Citizens’ Countries of Birth
- States and Cities of Residence
- Time as Lawful Permanent Residents
- Naturalization-Eligible Population
- Socioeconomic Characteristics of Naturalized Citizens
- Military Naturalizations
USCIS received about 823,700 petitions for naturalization in FY 2023, about 5 percent more than the 781,100 in FY 2022 but 17 percent fewer than the recent peak of 986,900 petitions submitted in FY 2017.
In contrast to more restrictive policies under the Trump administration, and to reduce the impact of the COVID-19 pandemic on application and processing backlogs, the Biden administration has emphasized reducing processing times and bureaucratic obstacles. The 2.7 million naturalizations in FY 2021-23 (roughly three years of the Biden administration) account for 34 percent of the total 7.7 million naturalizations over the last decade (FY 2014-23). The number of approved LPR applications has also been on the rise, surpassing pre-pandemic levels in FY 2023.
Applicants can be denied citizenship if they cannot prove the required length of permanent residence, are found to lack allegiance to the United States, are determined to have bad moral character, or fail the required English language or U.S. civics test. About 100,300 naturalization petitions were denied in FY 2023, a 10 percent drop from the 111,600 petitions denied in FY 2022. The number of denials in FY 2022 and FY 2023 were the highest since the late 2000s.
Click here for an interactive data tool showing the annual number of naturalizations in the United States since FY 1910.
Naturalized Citizens’ Countries of Birth
Immigrants from Mexico, India, the Philippines, the Dominican Republic, and Cuba represented the top countries of origin for new U.S. citizens in FY 2023, together accounting for 32 percent of the 878,500 newly naturalized immigrants (see Figure 2). A decade earlier, in FY 2014, immigrants from China ranked fourth, representing 5 percent of the 653,400 naturalizations. Jamaica, which was not a major origin country in FY 2014, was the ninth-largest origin for immigrants naturalizing in FY 2023, while Haiti, the tenth-largest origin in FY 2014, was no longer among the leading countries in FY 2023.
Figure 2. Top Countries of Birth for New Naturalized U.S. Citizens, FY 2023

Source: USCIS, “Naturalization Statistics,” updated May 9, 2024, available online.
States and Cities of Residence
Half of new citizens who naturalized in FY 2023 lived in either California, Texas, Florida, or New York (see Table 1). Altogether, 70 percent of all new naturalized citizens in FY 2023 lived in one of ten states.
Table 1. Top U.S. States of Residence of New Naturalized Citizens, FY 2023

Note: Table refers to the Core-Based Statistical Areas (CBSAs) of residence at the time a person applied for naturalization. Metropolitan Areas shown in the table are a type of CBSA.
Source: USCIS, “Naturalization Statistics.”
More than one-quarter of immigrants who naturalized in FY 2023 resided in one of three metropolitan areas: greater New York City (13 percent) or Los Angeles or Miami (6 percent each; see Table 2). Nearly half (48 percent) of all new naturalized U.S. citizens in FY 2023 lived in these three places as well as Houston, Dallas, Washington, DC, or Chicago (4 percent apiece), San Francisco (3 percent), or Seattle or Boston (2 percent each).
Table 2. Top U.S. Metropolitan Areas of Residence of New Naturalized Citizens, FY 2023
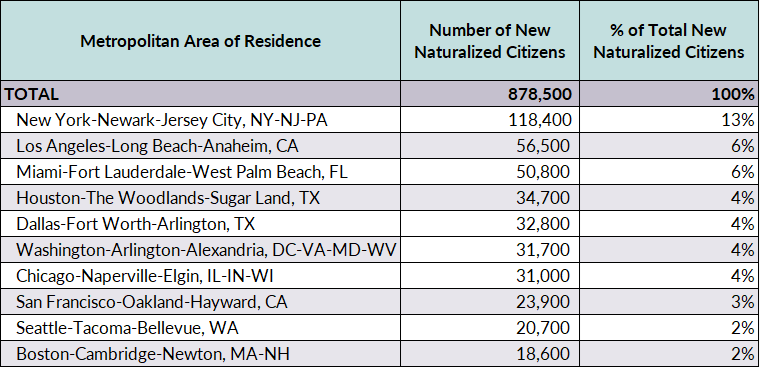
Note: Table refers to the Core Based Statistical Areas (CBSAs) of residence at the time a person applied for naturalization.
Source: USCIS, “Naturalization Statistics.”
Time as Lawful Permanent Residents
Those who naturalized in FY 2023 spent a median of seven years as green-card holders, with the number varying only slightly over the past decade (a median of seven years in the FY 2013-16 and FY 2020-22 periods, and eight years in the FY 2017-19 period).
The median time until naturalizing varies by place of birth. Mexicans and Canadians who naturalized in FY 2023 tended to wait the longest time before becoming citizens (about 10.4 years). Among other top source countries of newly naturalized citizens, Indians tended to spend 5.9 years before naturalization, Filipinos 6.7 years, Cubans 7.9 years, and Dominicans 9.5 years.
Immigrants from Africa and Asia generally have the shortest median times until they become citizens (six years as of FY 2022, the most recent data available), followed by South Americans and Europeans (seven or eight years). North Americans and those from Oceania consistently have the longest median times (ten years).
Figure 3. Median Years in Lawful Permanent Resident Status for New Naturalized U.S. Citizens, by Region of Origin, FY 2022

Source: Camille Caterina, U.S. Naturalizations: 2022 (Washington, DC: DHS, OHSS, 2023), available online.
The amount of time one spends as an LPR can be affected by a variety of factors, including linguistic barriers, access to naturalization test preparation classes, and ability to pay application fees. Immigrants may also wait to naturalize because of the trade-offs involved in gaining U.S. citizenship, which may include losing voting and other rights or property in their origin country.
Naturalization-Eligible Population
More than 9 million LPRs were estimated to be eligible to naturalize as of January 2023. Mexican green-card holders made up 26 percent of the eligible population, followed by LPRs born in China (6 percent) and Cuba, the Dominican Republic, and the Philippines (about 4 percent each).
California, New York, and Texas were home to almost half (48 percent) of the total 9 million LPRs eligible to naturalize (see Table 3). The top ten states accounted for 74 percent.
Table 3. Top U.S. States of Residence of Lawful Permanent Residents Eligible to Naturalize, 2023

Note: Table shows estimates as of January 1, 2023.
Source: Sarah Miller and Bryan Baker, Estimates of the Lawful Permanent Resident Population in the United States and the Subpopulation Eligible to Naturalize: 2023 (Washington, DC: DHS, OHSS, 2023), available online.
Socioeconomic Characteristics of Naturalized Citizens
Naturalized citizens tend to be older than other immigrants, with a median age of 53 compared to 40 for noncitizens.
They also tend to have higher educational attainment than noncitizens. Thirty-nine percent of naturalized adults (ages 25 and older) had at least a bachelor’s degree as of 2022, compared to 29 percent of noncitizen and 36 percent of native-born adults. At the same time, 18 percent of naturalized immigrant adults had not completed high school, a smaller share than noncitizens (34 percent) but larger than the rate for the U.S. born (7 percent).
Citizenship is associated with better economic outcomes. Occupationally, naturalized citizens are more likely to work in management, business, science, and arts fields (45 percent) than noncitizens (29 percent). In contrast, noncitizens are more represented in service occupations (24 percent versus 18 percent of citizens) and natural resources, construction, and maintenance occupations (18 percent versus 7 percent).
Reflecting higher levels of education and better-paid occupations, median earnings for naturalized citizens ($67,000 for men, $54,000 for women) tend to be much higher than those of noncitizens ($46,000 for men, $38,000 for women). This economic advantage is also reflected in naturalized citizens’ higher median household incomes ($84,000 versus $64,000) and lower poverty rates (10 percent versus 18 percent).
Serving in the U.S. armed forces offers some immigrants an expedited path to citizenship, which has long been used to encourage them to enlist. In FY 2023, more than 12,100 foreign-born members of the U.S. military naturalized, up from 10,700 in FY 2022, 4,400 in FY 2019, and the most since FY 1954 (13,700).
Currently, foreign-born military service members are exempt from residence and physical presence requirements of naturalization, and from paying filing fees. Military naturalizations grew significantly from 2002 to 2016, after President George W. Bush’s Executive Order 13269 allowed noncitizen service members to apply for expedited citizenship. Termination in 2017 of the Military Accessions Vital to the National Interest (MAVNI) program, which allowed the armed forces to recruit certain lawfully present noncitizens with critical skills, contributed to a decline in military naturalizations for several subsequent years.
The downward trend in military naturalizations was reversed after President Joe Biden’s 2021 executive order promoting naturalization. USCIS began conducting video naturalization interviews, expanding access to service members serving abroad. And the U.S. Air Force, Navy, and Department of Veterans Affairs have implemented processes to inform present and former service members about naturalization eligibility.
Click here to read a policy brief on the role of noncitizens in the U.S. military and recent changes in military naturalizations.
Sources
Caterina, Camille. 2023. U.S. Naturalizations: 2022. Washington, DC: U.S. Department of Homeland Security (DHS), Office of Homeland Security Statistics (OHSS). Available online.
Immigrant Legal Resource Center (ILRC). 2023. USCIS Naturalization Test Redesign—Flaws in Design and Transparency. ILRC webinar, September 20, 2023. Available online.
Miller, Sarah and Bryan Baker. 2023. Estimates of the Lawful Permanent Resident Population in the United States and the Subpopulation Eligible to Naturalize: 2023. Washington, DC: DHS, OHSS. Available online.
Straut-Eppsteiner, Holly. 2024. U.S. Naturalization Policy. Washington, DC: Congressional Research Service. Available online.
U.S. Citizenship and Immigration Services (USCIS). 2020. Who’s #1? Certificate of Naturalization #1 and the ‘First Naturalized U.S. Citizen.’ Updated July 28, 2020. Available online.
---. 2023. Military Naturalization Statistics. Updated November 8, 2023. Available online.
---. 2023. Naturalization Test Performance. Updated October 5, 2023. Available online.
---. 2024. Eligible to Naturalize Dashboard. Updated June 18, 2024. Available online.
---. 2024. N-400, Application for Naturalization. Updated June 11, 2024. Available online.
---. 2024. Naturalization Statistics. Updated May 9, 2024. Available online.
---. N.d. Historical National Median Processing Time (in Months) for All USCIS Offices for Select Forms by Fiscal Year. Accessed July 3, 2024. Available online.
U.S. Department of Homeland Security. 2024. U.S. Citizenship and Immigration Services Fee Schedule and Changes to Certain Other Immigration Benefit Request Requirements. Federal Register 89, no. 20 (January 31, 2024): 76634-76637. Available online.
U.S. Department of Homeland Security, Office of Homeland Security Statistics. Yearbook of Immigration Statistics. Updated February 12, 2024. Available online.
U.S. Government Accountability Office (GAO). 2022. Military Naturalizations: Federal Agencies Assist with Naturalizations, but Additional Monitoring and Assessment Are Needed. Washington, DC: GAO. Available online.
White House. 2021. Executive Order on Restoring Faith in Our Legal Immigration Systems and Strengthening Integration and Inclusion Efforts for New Americans. Updated February 2, 2021. Available online.