Indian Immigrants in the United States

Click here for a larger version of map.
In 2011, 75 percent of Indian-born adults in the United States held a bachelor's degree or higher.
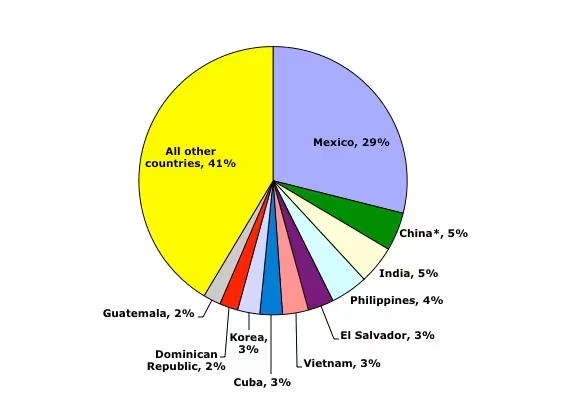
The nearly 1.9 million Indian immigrants living in the United States in 2011 represented the third-largest immigrant group by country of origin, behind Mexico and China. The share of Indian immigrants among all foreign born in the United States grew from less than 0.5 percent in 1960 to almost 5 percent in 2011.
|
Ten Source Countries with the Largest Populations in the United States as Percentages of the Total Foreign-Born Population: 2011
|
||
|
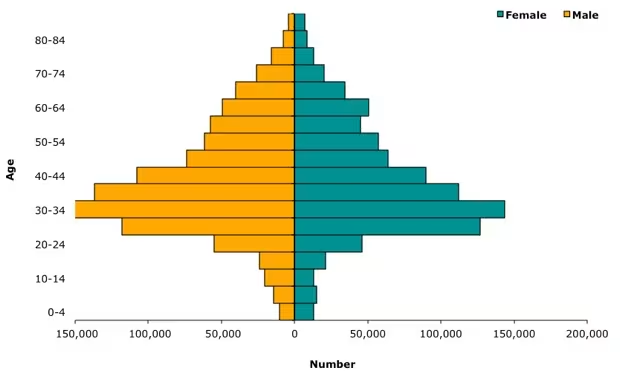
As a group, immigrants from India are better educated, more likely to have strong English language skills and arrive on employment-based visas, and are less likely to live below the federal poverty line than the overall foreign-born population. They are also more concentrated in the working ages than immigrants overall, and Indian-born men outnumber Indian-born women. In 2011, India was the second most common country of origin for international students at U.S. institutions of higher learning, behind China.
|
Indian-Born Population, by Age and Sex, for the United States: 2011
|
||
|
This article reports on a wide range of characteristics of Indian immigrants residing in the United States, including the population's size, geographic distribution, admission categories, and demographic and socioeconomic characteristics. Data are from the U.S. Census Bureau's 2011 American Community Survey (ACS), the 2000 Decennial Census (as well as earlier censuses), and the Department of Homeland Security's (DHS) Office of Immigration Statistics (OIS) (2012 data).
Size and Geographic Distribution
- In 2011, nearly 1.9 million Indian immigrants resided in the United States.
- Almost one-third of all Indian immigrants resided in just two states: California and New Jersey.
- More than one-quarter of all Indian immigrants lived in three major metropolitan areas: greater New York, Chicago, and San Jose.
|
Definitions
|
||
|
Modes of Entry and Legal Status
- In 2012, more than 66,000 Indian-born immigrants were granted U.S. legal permanent residency.
- Compared to all immigrants who gained LPR status in 2012, Indians were more likely to arrive through an employment-based channel.
- Indian nationals accounted for about 1 percent of persons granted asylum in 2012.
- Nearly 43,000 Indian immigrants became naturalized U.S. citizens in 2012.
- The share of Indian immigrants who have naturalized (47 percent) is slightly greater than that of the overall foreign-born population (45 percent).
- More than 46 percent of Indian-born green card holders in 2012 were eligible to naturalize.
- More than one-fifth of nonimmigrants in the United States in 2011 were from India.
- India was the second most common country of origin for international students studying at U.S. institutions of higher learning in 2011.
- As of July 31, 2013, 2,269 Indian unauthorized immigrant youth had been approved for two-year deportation relief under the Deferred Action for Childhood Arrivals (DACA) initiative.
- In early 2011, 2 percent of all unauthorized immigrants in the United States were from India.
Demographic and Socioeconomic Overview
- Indian immigrant men outnumbered women in 2011.
- The foreign born from India were more likely than the native born and the foreign born overall to be of working age.
- More than 70 percent of all Indian immigrants ages 5 and older have strong English-language skills.
- As a group, Indian-born adults were substantially more likely to be college graduates than all immigrant and native-born adults.
- The Indian born were more likely to be recent immigrants than the foreign born overall.
- More than 29 percent of employed Indian-born men worked in information technology occupations, while 19 percent of employed Indian-born women worked in management, business, and finance.
- The Indian born were less likely to live in poverty in 2011 than the native born and foreign born overall.
- Indian immigrants had a higher rate of homeownership than immigrants overall and the native born in 2011.
- Indian immigrants were more likely than immigrants overall to have health insurance in 2011.
- About 664,000 children under the age of 18 resided in a household with at least one immigrant parent born in India.
Size and Geographic Distribution
In 2011, nearly 1.9 million Indian immigrants resided in the United States.
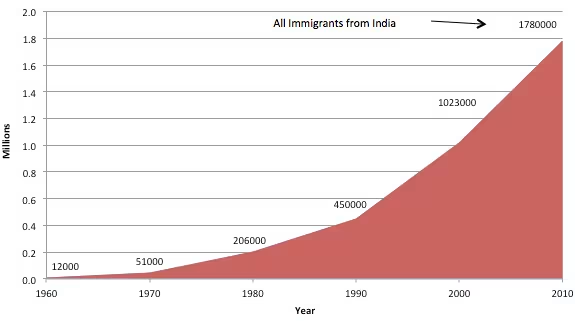
Indian-born immigrants accounted for almost 5 percent (1.86 million) of the country's 40.4 million immigrants in 2011. This population has grown to over 150 times its size since 1960, when the slightly more than 12,000 Indian immigrants represented less than 0.5 percent of the total immigrant population of 9.7 million immigrants.
Indians' share of Asian immigrants in the United States has been increasing steadily since 1960 (see Table 1 and Figure 1), making it the third-largest sending country overall and the second-largest Asian sending country after China.
|
Table 1. Indian-Born Share of All Asian Immigrants, 1960-2011
|
||||||||||||||||||||||||||||||||||||||||||||||||||||||||
|
||||||||||||||||||||||||||||||||||||||||||||||||||||||||
|
Figure 1. Number of Indian Born in the United States, 1960-2010
|
||
|
Almost one-third of all Indian immigrants resided in just two states: California and New Jersey.
California had the largest number of Indian immigrants in 2011 (380,700 or 21 percent of the nation's nearly 1.9 million Indian born), followed by New Jersey (210,400, or 11 percent). Other states with Indian immigrant populations greater than 100,000 were Texas (162,400, or 9 percent); New York (145,400, or 8 percent); and Illinois (127,200, or 7 percent).
In terms of share of the states' respective immigrant populations, the Indian born made up 12 percent of all immigrants in Delaware (8,900 out of 76,400), 11 percent in New Jersey (210,400 out of 1.9 million), and 10 percent in Ohio (46,200 out of 456,400).
More than one-quarter of all Indian immigrants lived in three major metropolitan areas: greater New York, Chicago, and San Jose.
The largest concentration of Indian immigrants was in the greater New York metropolitan area, where 304,300 lived (representing 16 percent of all Indian born in the United States). The greater Chicago area was second with 114,000 Indian immigrants (6 percent), followed by the greater San Jose area with 90,000 (5 percent). Overall, about 27 percent (508,200) of the Indian population lived in these three areas.
Other metropolitan areas with Indian-born populations greater than 60,000 were San Francisco, CA (86,800, or 5 percent of 1.9 million Indian born in the United States); Washington, DC (82,300, or 4 percent); Los Angeles, CA (82,200, or 4 percent); Dallas, TX (66,100, or 4 percent); and Philadelphia, PA (62,200, or 3 percent).
In terms of share of cities' respective immigrant populations, the Indian born made up 15 percent of all immigrants in Trenton, NJ (11,200 out of 74,700); 14 percent in Richmond, VA (12,600 out of 90,500); and 14 percent in Raleigh-Cary, NC (18,000 out of 132,900).
Modes of Entry and Legal Status
Note: This section is based on 2012 DHS data, unless stated otherwise. DHS data refer to the U.S. government's fiscal year, October 1 through September 30. Thus, "2012" refers to October 1, 2011 through September 30, 2012.
In 2012, more than 66,000 Indian-born immigrants were granted U.S. legal permanent residency.
In 2012, 66,434 Indian immigrants obtained green cards, accounting for 6 percent of the 1,031,631 immigrants granted LPR status. Indians were the third-largest country-of-origin group to obtain LPR status in 2012, after Mexicans (146,406, or 14 percent) and Chinese (81,784, or 8 percent).
Compared to all immigrants who gained LPR status in 2012, Indians were more likely to arrive through an employment-based channel.
Fifty percent of all Indian immigrants granted LPR status in 2012 were admitted through employment-based preferences, compared to 14 percent of all immigrants receiving green cards that year. About 48 percent of Indians granted LPR status in 2012 were admitted through family relationships compared to 66 percent of LPR immigrants overall.
The remaining 2 percent of Indian immigrants granted LPR status in 2012 were admitted through other routes, consisting mostly of asylees.
- For more information, see the DHS OIS flow report on U.S. Legal Permanent Residents: 2012.
Indian nationals accounted for about 1 percent of persons granted asylum in 2012.
The 377 Indian nationals granted asylum in 2012 represented just over 1 percent of all 29,484 asylees. From 2003 to 2012, Indian nationals accounted for about 2 percent (4,645) of the 253,470 individuals granted asylum. There were no Indian nationals who arrived in the United States as refugees in 2012.
- For more information, see the DHS OIS flow report on Refugees and Asylees: 2012.
Nearly 43,000 Indians became naturalized U.S. citizens in 2012.
In 2012, 42,928 Indian immigrants were naturalized in the United States, representing about 6 percent of the 757,434 new U.S. citizens that year. Indian immigrants were the third-largest country-of-origin group to naturalize in 2012, after Mexicans (102,181, or 14 percent of all new U.S. citizens) and Filipinos (44,958, or 6 percent).
The share of Indian immigrants who are naturalized U.S. citizens (47 percent) is slightly greater than that of the overall foreign-born population (45 percent).
According to the 2011 ACS, about 47 percent of Indian immigrants (863,000 of nearly 1.9 million) were naturalized U.S. citizens. This was slightly greater than the estimated share among all immigrants, which was about 45 percent (18.2 million of 40.4 million).
More than 46 percent of Indian-born green card holders in 2012 were eligible to naturalize.
DHS' OIS estimates that 240,000 Indian LPRs, or about 44 percent of the 540,000 Indian-born green-card holders, were eligible to naturalize in 2012. Indian LPRs represented about 3 percent of all 8.8 million LPRs eligible to naturalize in 2012.
- For more information, see the DHS OIS report Estimates of the Legal Permanent Resident Population in 2012.
More than one-fifth of nonimmigrants in the United States in 2011 were from India.
Of the estimated 1.9 million nonimmigrants (which include temporary workers, students, exchange visitors, diplomats, other representatives, and accompanying family members) living in the United States in 2011, approximately 420,000 (22 percent) were Indian. Indians were the largest origin group of nonimmigrants, followed by China (180,000, or 9 percent), South Korea (150,000, or 8 percent), and Canada (150,000, or 8 percent).
Almost three-quarters of the nonimmigrant population from India was comprised of temporary workers (about 73 percent). The remaining Indian nonimmigrant population consisted of students (24 percent) and exchange visitors (2 percent).
Nearly two-thirds of Indian nonimmigrants were between ages 25 and 34 (65 percent, or 280,000) and approximately 58 percent (250,000) were male.
- For more information, see DHS OIS' Estimates of the Size and Characteristics of the Resident Nonimmigrant Population in the United States: January 2011.
India was the second most common country of origin for international students studying at U.S. institutions of higher learning in 2011.
According to the Institute of International Education, students from India accounted for 13 percent (100,270) of the 764,495 international students studying at U.S. institutions of higher learning during the 2011-12 academic year. India was the second largest origin country of international students in the United States, behind China (25 percent of international students in the United States).
- For more information, see the Institute of International Education's Fast Facts Open Doors 2012 report.
As of July 31, 2013, 2,269 Indian unauthorized immigrant youth had been approved for a two-year deportation reprieve under the Deferred Action for Childhood Arrivals (DACA) initiative.
A total of 2,269 Indian unauthorized immigrant youth had been approved under the DACA initiative, which offers a two-year reprieve from deportation as well as work authorization for unauthorized immigrants who arrived as children and meet certain age, education, and other criteria. Of all 552,918 DACA applications accepted for processing (as of July 31, 2013), 2,835 were from Indian immigrants, making India the 13th largest country of origin for accepted DACA applications.
- Read the Migration Policy Institute's brief about DACA-eligible youth, Deferred Action for Childhood Arrivals at the One-Year Mark: A Profile of Currently Eligible Youth and Applicants.
- View U.S. Citizenship and Immigration Services data on number of applications and petitions submitted, approved, and denied between August 15, 2012 and July 31, 2013.
In early 2011, 2 percent of all unauthorized immigrants in the United States were from India.
The DHS OIS estimated that in January 2011, 240,000 (2 percent) of approximately 11.5 million unauthorized immigrants in the United States were born in India.
For more, see DHS OIS' Estimates of the Unauthorized Immigrant Population Residing in the United States: January 2011.
Demographic and Socioeconomic Overview
Note: This section is based on the authors' analysis of 2011 ACS data.
Indian immigrant men outnumbered women in 2011.
Of all Indian immigrants residing in the United States in 2011, 53 percent were men and 47 percent women. By contrast, gender distributions were slightly more balanced among the native born and overall foreign born (about 51 percent female and 49 percent male for both groups).
The foreign born from India were more likely than the native born and the foreign born overall to be of working age.
Of the Indian born residing in the United States in 2011, 85 percent were of working age (16 to 64 years old), compared to 63 percent of the native born and 82 percent of all immigrants. Among Indian immigrants, almost 10 percent were older than 64, compared to 13 percent of the native- and foreign-born populations.
More than 70 percent of all Indian immigrants have strong English-language skills.
In 2011, 9 percent of Indian immigrants ages 5 and older reported speaking only English, and 63 percent reported speaking English "very well." In contrast, 18 percent reported speaking English "well;" 6 percent reported speaking English, but "not well;" and less than 3 percent of all Indian immigrants reported not speaking English at all.
Compared to immigrants overall, Indian immigrants were less likely to be Limited English Proficient (LEP), (LEP means that the respondent reported speaking English less than "very well"). Only 27 percent of Indian immigrants were LEP, versus 51 percent of all immigrants.
Note: In the ACS, respondents ages 5 and older who reported that they spoke a language other than English at home were asked to self-assess their English-speaking abilities with the options of "not at all," "not well," "well," or "very well."
As a group, Indian-born adults were substantially more likely to be college graduates than all immigrant and native-born adults.
In 2011, 75 percent of Indian-born adults (ages 25 and older) had a bachelor's degree or higher—substantially higher than among immigrant adults overall (27 percent) and native-born adults (29 percent).
The share of Indian-born adults with no high school diploma or GED (8 percent) was lower than the share of native-born adults (11 percent) and immigrant adults overall (31 percent). The share of Indian born who reported their highest educational attainment as an associate's degree or less (17 percent) was much lower than the foreign born overall (41 percent) and the native born (61 percent).
Indians were more likely to be recent immigrants than the foreign born overall.
In 2011, approximately 52 percent of the nearly 1.9 million Indian immigrants in the United States had entered in 2000 or later; 26 percent arrived between 1990 and 1999; 13 percent entered between 1980 and 1989; and close to 10 percent entered prior to 1980.
The Indian born tend to have arrived more recently than the overall immigrant population in the United States: Among all immigrants, 36 percent arrived in 2000 or later; 27 percent arrived between 1990 and 1999; 18 percent entered between 1980 and 1989; and 19 percent entered prior to 1980.
More than 29 percent of employed Indian-born men worked in information technology occupations, while 19 percent of employed Indian-born women worked in management, business, and finance.
The top three occupations that employed Indian-born men ages 16 and older were information technology (29 percent of all 717,000 Indian male workers); management, business, and finance (21 percent); and sales (11 percent).
Compared to working immigrant men overall, Indian men were more likely to report working in the science and technology sector—specifically in information technology and other science and engineering occupations—and in business and sales occupations. They were less likely to report working in construction, extraction, and transportation; service and personal care; and manufacturing, installation, and repair occupations (see Table 2).
|
Table 2. Occupations of Employed Workers in the Civilian Labor Force (Ages 16 to 64) by Gender and Origin, 2011
|
|||||||||||||||||||||||||||||||||||||||||||||||||||||||||||||||||||||||||||||||||||||||||||||||||
|
|||||||||||||||||||||||||||||||||||||||||||||||||||||||||||||||||||||||||||||||||||||||||||||||||
Among the 415,000 Indian-born female workers ages 16 to 64, 19 percent reported working in management, business, and finance; 16 percent in information technology; and 11 percent in sales.
Indian-born female workers were more likely than working immigrant women overall to report working in information technology (16 percent versus 2 percent) and management occupations (19 percent versus 11 percent). They were far less likely than immigrant women overall to report working in service and personal care (6 percent versus 27 percent) and health-care support occupations (2 percent versus 6 percent).
The Indian born were less likely to live in poverty in 2011 than the native born and foreign born overall.
In 2011, a much smaller share of Indian immigrants (7 percent) lived in households with an annual income below the federal poverty line than the native born (15 percent) and immigrants overall (20 percent).
Indian immigrants had a higher rate of homeownership than immigrants overall and the native born in 2011.
In 2011, the homeownership rate among Indian immigrant households was 55 percent. This was somewhat higher than the share of immigrant households overall (52 percent) and lower than the homeownership rate for the native born (67 percent).
Among those living in owned homes, Indian immigrants (18 percent) were less likely than the foreign born overall (28 percent) and the native born (34 percent) to reside in a household without a mortgage or home loan.
- For more, see the U.S. Census Bureau's Estimates of Homeownership Among the Foreign-Born Population: 2011.
Indian immigrants were more likely than immigrants overall in 2011 to have health insurance.
While 14 percent of Indian immigrants lacked health insurance coverage in 2011, about one-third (33 percent) of immigrants overall were uninsured. The share of native born who were uninsured (12 percent) was nearly the same as that of the Indian born.
Among those with health insurance coverage, Indian immigrants (78 percent) were more likely than immigrants overall (49 percent) and the native born (68 percent) to be covered by private health insurance alone or in combination with some form of public coverage.
Note: Includes only the civilian noninstitutionalized population. Excludes individuals residing in military barracks, correctional institutions, mental institutions, and institutions for the elderly, handicapped, and poor.
About 664,000 children under the age of 18 resided in a household with at least one parent born in India.
The 664,000 children with at least one Indian-born parent represented 4 percent of the overall population of children from immigrant households (17.1 million children). The vast majority of children in Indian immigrant families were born in the United States (about 81 percent), slightly lower than the native-born share of the overall child population in immigrant households (about 87 percent).
Note: Includes only children who reside with at least one parent who is foreign born. Excludes families with U.S.-born parents with foreign adopted children.
For more information about ACS data and methodology, click here.
Sources
Institute of International Education. 2012. Fast Facts Open Doors 2012 report. Available online.
Jeanne Batalova, Sarah Hooker, and Randy Capps with James D. Bachmeier and Erin Cox. 2013. Deferred Action for Childhood Arrivals at the One-Year Mark: A Profile of Currently Eligible Youth and Applicants. Available online.
U.S. Census Bureau. 2011. 2011 American Community Survey (ACS), Table B05006, Place of Birth for the Foreign-Born Population. Available online.
U.S. Department of Homeland Security, U.S. Citizenship and Immigration Services. 2013. Deferred Action for Childhood Arrivals. Data on Individual Applications and Petitions. Available online.
U.S. Department of Homeland Security, Office of Immigration Statistics. 2011. 2011 Yearbook of Immigration Statistics, various tables. Available online.
Authors' analysis of the U.S. Census Bureau's 2011 ACS. Accessed from Steven Ruggles, J. Trent Alexander, Katie Genadek, Ronald Goeken, Matthew B. Schroeder, and Matthew Sobek. Integrated Public Use Microdata Series: Version 5 [Machine-readable database]. Minneapolis, MN: Minnesota Population Center [producer and distributor], 2010. Available online.


