Age-Sex Pyramids of U.S. Immigrant and Native-Born Populations, 1970-Present

Age-Sex Pyramids of U.S. Immigrant and Native-Born Populations, 1970-Present
Pyramids visually represent the distribution of a population by age and sex. In many ways, an age-sex pyramid is a summation of a population's history, reflecting long-term trends in birth and death rates and even short-term changes resulting from baby booms and busts, wars, and epidemics. Because of differences in scale, the age-sex pyramids are not always directly comparable in terms of absolute population sizes. This tool allows you to view the pyramids over time, using the year tab under the figure.
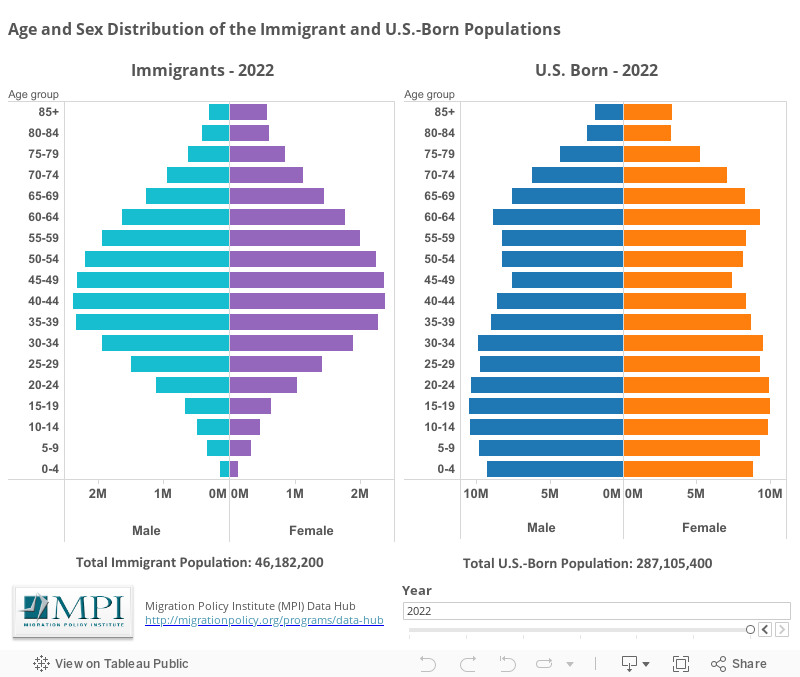
Immigrant population: The shape of the age-sex pyramid of the immigrant population is very different from that of the native-born population for a number of reasons. First, many migrants migrate to find work abroad, so a high number in the economically active 25-to-59 age bracket is not uncommon. As can be seen here, the majority of immigrants in 2024 were adults between the ages of 25 and 59. Second, in general, children are less likely to migrate by themselves and adult immigrants tend to migrate with few or no children. This helps explain the relatively small amount of people ages 20 and younger. There is another reason, however: the children born in the United States to adult immigrants are included in the native-born population estimates. Third, people are less likely to migrate at older ages. In the foreign-born age-sex pyramid, there are fewer people in the retirement-age groups (65 and over). This low number of older immigrants also has to do with some returning home for retirement and the death of some older immigrants. All of these factors give the foreign-born age-sex pyramid its "diamond shape," making it significantly different from the native population pyramid. About 50.2 million immigrants resided in the United States in 2024.
Native-born population: The most striking feature of the native age-sex pyramid is the “baby boom,” the increase in the number of people born after World War II, between 1946 and 1964. In 2024, baby boomers were between ages 60 and 78, as can be seen by the relatively large size of those age groups in the age-sex pyramid. The years 1965 to about 1977 are often referred to as the “baby bust” because of the smaller number of children born then. The “baby bust” generation was between the ages of 47 and 59 in 2024, as can be seen by the constriction of those age groups in the age-sex pyramid. The “echo boom” or “boomlet” occurred between 1977 and about 1988, when many baby boomers had children who, in 2024, were between ages 36 and 47.
Migration Policy Institute (MPI) tabulation of data from U.S. Census Bureau, 2024 and 2019 American Community Survey (ACS), and 1970, 1980, 1990, and 2000 Decennial Census data accessed from Steven Ruggles, Sarah Flood, Matthew Sobek, Daniel Backman, Annie Chen, Grace Cooper, Stephanie Richards, Renae Rodgers, and Megan Schouweiler. IPUMS USA: Version 15.0 [dataset]. Minneapolis, MN: IPUMS, 2024. https://doi.org/10.18128/D010.V15.0.