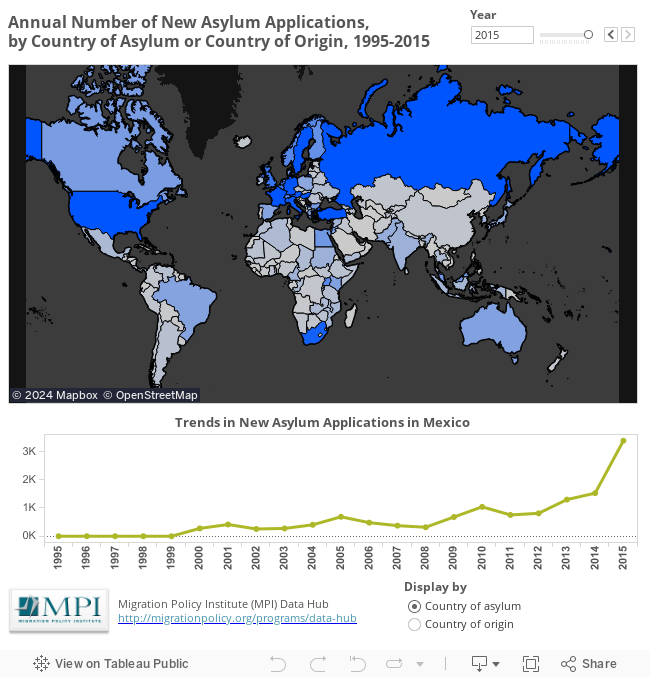
This map illustrates the global distribution of new asylum applications by country of filing and applicants' country of origin, using data from the UN High Commissioner for Refugees (UNHCR). The darker the color, the more new asylum applications a destination country received or the more applications were submitted from a particular origin country per year. Scroll over the given country to view the new application statistics. Use the year slider above the map to view the global distribution over time. The default year is 2015. The chart below the map shows the trend data in new asylum applications for a select country. The default country displayed is Mexico. Click on a country of interest on the map to view how the number of applications changed between 1995 and 2015.
Data for 2006 to 2014 are from Migration Policy Institute (MPI) tabulation of data from UNHCR, Statistical Yearbook (Geneva: UNHCR, various years), www.unhcr.org/en-us/search?comid=56b07b944&&scid=49aea93a5b&tid=49ec6f1727; data for 2000 to 2005 and 2015 are from MPI tabulation of data from the UNHCR Statistical Online Population Database, data extracted on August 15, 2016, http://popstats.unhcr.org/en/overview; data for 1995 to 1999 are from MPI tabulation of data from UNHCR, Statistical Yearbook 2004 (Geneva: UNHCR, 2005), www.unhcr.org/en-us/statistics/country/44e96c842/unhcr-statistical-yearbook-2004.html.