

South American Immigrants in the United States

Nearly 3 million South American immigrants lived in the United States in 2014. (Photo: Thomas Hawk)
South American immigrants in the United States, though small in absolute numbers compared to those from Mexico and Central America, experienced the fastest growth since 1960 among all Latin American immigrant groups. The number of South American immigrants grew from 90,000 in 1960 to around 2.9 million in 2014, representing a 32-fold increase. In 1960, South Americans accounted for just 1 percent of the total foreign-born population in the United States; by 2014, their share increased to 7 percent of the nation’s 42.4 million immigrants.
Immigration from South America grew most rapidly from 1960 to 1980, with the number of South Americans residing in the United States more than doubling each decade (increasing by 285 percent in the 1960s and 220 percent in the 1970s). Since then, the population has continued to rise, but at a slower pace (see Figure 1).
Figure 1. South American Immigrant Population in the United States, 1980-2014

Sources: Data from U.S. Census Bureau 2006, 2010, and 2014 American Community Surveys (ACS), and Campbell J. Gibson and Kay Jung, "Historical Census Statistics on the Foreign-born Population of the United States: 1850-2000" (Working Paper no. 81, U.S. Census Bureau, Washington, DC, February 2006), available online.
In 2014, the five largest countries of origin were Colombia (707,000, or 25 percent of all South American immigrants), Peru (449,000, 16 percent), Ecuador (424,000, 15 percent), Brazil (336,000, 12 percent), and Guyana (273,000, 10 percent). Together, they accounted for more than three-quarters (77 percent) of the total South American immigrant population.
Table 1. Distribution of South American Immigrants by Country of Origin, 2014

Source: Migration Policy Institute (MPI) tabulation of data from the U.S. Census Bureau, 2014 ACS.
Click here for an interactive chart showing changes in the number of immigrants from South America in the United States over time. Select individual South American countries from the dropdown menu.
Of the total 11.6 million South American migrants worldwide, more than one-third (35 percent) resided in other South American countries, with the rest scattered in Europe and North America. The United States is the primary destination, representing 25 percent of the global total, followed by Spain (16 percent), Argentina (15 percent), and Venezuela (10 percent), according to mid-2015 estimates by the United Nations Population Division.
Click here to view an interactive map showing where migrants from each South American country have settled worldwide.
On average, most South American immigrants obtained lawful permanent residence in the United States (also known as receiving a green card) through family ties. By and large, South American immigrants mirrored the sociodemographic characteristics of the overall immigrant population with a few exceptions: they were slightly more educated, were more likely to participate in the labor force, and had higher household incomes.
Using data from the U.S. Census Bureau (the most recent 2014 American Community Survey [ACS] and pooled 2010-14 ACS data), the Department of Homeland Security’s Yearbook of Immigration Statistics, and the World Bank's annual remittance data, this Spotlight provides information on the South American immigrant population in the United States, focusing on its size, geographic distribution, and socioeconomic characteristics.
Note: Socioeconomic characteristics for immigrants from Uruguay are based on pooled 2011-13 ACS data.
Click on the bullet points below for more information:
- Distribution by State and Key Cities
- English Proficiency
- Age, Education, and Employment
- Income and Poverty
- Immigration Pathways and Naturalization
- Health Coverage
- Diaspora
- Remittances
Distribution by State and Key Cities
More than half (56 percent) of South American immigrants have settled in three states: Florida (24 percent), New York (21 percent), and New Jersey (11 percent). The top four counties with South American immigrants in the period 2010-14 were Miami-Dade County in Florida, Queens County in New York, Broward County in Florida, and Los Angeles County in California. Together, these four counties accounted for about 26 percent of the total South American immigrant population in the United States.
Figure 2. Top Destination States for South American Immigrants in the United States, 2010-14

Note: Pooled 2010-14 ACS data were used to get statistically valid estimates at the state level for smaller-population geographies.
Source: MPI tabulation of data from U.S. Census Bureau pooled 2010-14 ACS.
Click here for an interactive map showing the geographic distribution of immigrants by state and county. Select individual South American countries or the region from the dropdown menu to see which states and counties have the most South American immigrants.
In the 2010-14 period, the U.S. cities with the largest number of South American immigrants were the greater New York, Miami, and Washington, DC metropolitan areas. These three metropolitan areas accounted for 51 percent of all South American immigrants in the United States.
Figure 3. Top Metropolitan Destinations for South American Immigrants in the United States, 2010-14

Note: Pooled 2010-14 ACS data were used to get statistically valid estimates at the state level for smaller-population geographies.
Source: MPI tabulation of data from U.S. Census Bureau pooled 2010-14 ACS.
Click here for an interactive map highlighting the metropolitan areas with the highest concentrations of immigrants. Select individual South American countries or the region from the dropdown menu to see which metropolitan areas have the most South American immigrants.
Table 2. Top Concentrations by Metropolitan Area for the Foreign Born from South America, 2010-14

Source: MPI tabulation of data from the U.S. Census Bureau pooled 2010-14 ACS.
South American immigrants were somewhat more likely to be proficient in English than the overall foreign-born population. In 2014, approximately 45 percent of South American immigrants (ages 5 and over) reported limited English proficiency, compared to 50 percent of all immigrants. Very few immigrants from English-speaking Guyana (2 percent) were Limited English Proficient (LEP), while Argentina (35 percent), Venezuela (38 percent), Chile (39 percent), Brazil (40 percent), and Bolivia (40 percent) had relatively low shares of LEP individuals. Meanwhile, more than half of Peruvians (52 percent), Colombians (53 percent), and Ecuadorans (65 percent) reported limited English proficiency.
Note: Limited English proficiency refers to those who indicated on the ACS questionnaire that they spoke English less than “very well.”
Age, Education, and Employment
South American immigrant adults overall were older than the native-born population. The median age of South American immigrants was 45 years—compared to 44 for the foreign born and 36 for the U.S. born. In 2014, South American immigrants were more likely to be of working age (18 to 64, see Table 3) and less likely to be under age 18 than both the native- and foreign-born populations. Most immigrants from Brazil (89 percent), Venezuela (85 percent), and Ecuador (83 percent) were of working age, while a sizable share of those from Chile (20 percent), Brazil (18 percent), and Guyana (17 percent) were seniors (ages 65 and older).
Table 3. Age Distribution by Origin, 2014

Source: MPI tabulation of data from the U.S. Census Bureau, 2014 ACS. Numbers may not add up to 100 as they are rounded to the nearest whole number.
Education
South American immigrant adults (ages 25 and older) were much more likely to have at least a high school education than all foreign-born adults, but had similar shares of college graduates compared to both the total foreign- and native-born populations. In 2014, 16 percent of South American immigrants had not finished high school, compared to 30 percent of all immigrants and 10 percent of U.S.-born adults. Approximately 30 percent of South American adults had a bachelor’s degree or higher, versus 29 percent of the total immigrant population and 30 percent of native-born adults. Immigrants from Venezuela, Argentina, Brazil, and Chile were more educated than those from other South American countries: more than half of immigrants from Venezuela (52 percent) and more than one-third of those from Argentina and Brazil (38 percent each) and Chile (34 percent) were college graduates, compared to 16 percent of immigrants from Ecuador and 19 percent from Uruguay.
In school year (SY) 2014-15, 52,000 South American students were enrolled in U.S. higher educational institutions, representing 5 percent of the total 975,000 international students. Brazil (24,000), Venezuela (8,000), and Colombia (7,000) were the top three origin countries. Between SYs 2013-14 and 2014-15, the number of South American students in the United States increased 31 percent (from 39,000 to 52,000), a trend largely driven by the rising number of students from Brazil (from 13,000 to 24,000).
Employment
South American immigrants participated in the labor force at a higher rate than the overall immigrant population. In 2014, about 70 percent of South American immigrants ages 16 and over were in the civilian labor force, compared to 66 percent and 62 percent of the foreign and U.S. born, respectively.
South American immigrants closely tracked the occupational distribution of all immigrant workers. At the same time, they were less likely than their U.S.-born counterparts to be employed in management, business, science, and arts occupations (30 percent versus 38 percent) or sales and office occupations (21 percent and 25 percent, see Figure 4).
Figure 4. Employed Workers in the Civilian Labor Force (ages 16 and older) by Occupation and Origin, 2014

Source: MPI tabulation of data from the U.S. Census Bureau 2014 ACS.
A significant share of immigrant workers from Venezuela (45 percent), Argentina (41 percent), and Brazil and Chile (35 percent each) were employed in management, business, science, and arts occupations, while Ecuadoran workers (30 percent) were the most likely to be in natural resources, construction, and maintenance occupations.
On average, South American immigrants had higher incomes than the total foreign-born population. In 2014, the median income of households headed by a South American immigrant was $52,000, compared to $49,000 and $55,000 for overall immigrant and native-born households, respectively. Households headed by immigrants from Bolivia ($62,000), Guyana ($58,000), Venezuela ($57,000), and Brazil ($56,000) had the highest median incomes, while Ecuadoran ($48,000) and Uruguayan ($47,000) households had the lowest median incomes.
In 2014, South American immigrants were less likely than both foreign- and native-born individuals to be in poverty—14 percent versus 19 percent and 15 percent, respectively. Ecuadorans were the most likely to be in poverty (17 percent).
Immigration Pathways and Naturalization
South American immigrants were slightly more likely than the total foreign-born population to be naturalized citizens. As of 2014, 52 percent of the 2.9 million South American immigrants residing in the United States were naturalized U.S. citizens, compared to 47 percent of all immigrants. Immigrants from Guyana (74 percent) and Colombia (59 percent) had the highest naturalization rates, while those from Brazil (37 percent) and Uruguay (39 percent) were the least likely to be naturalized.
On average, South Americans were somewhat more likely than all immigrants to have entered the United States between 2000 and 2009 and less likely to have arrived before 2000 (see Figure 5). More than two-thirds of immigrants from Chile and Guyana (68 percent each) entered before 2000, half of Uruguayans entered between 2000 and 2009, while immigrants from Brazil and Venezuela represented more recent flows, with about one-fifth of each group arriving in 2010 or later (20 percent and 22 percent, respectively).
Figure 5. Immigrants from South America and All Immigrants in the United States by Period of Arrival, 2014
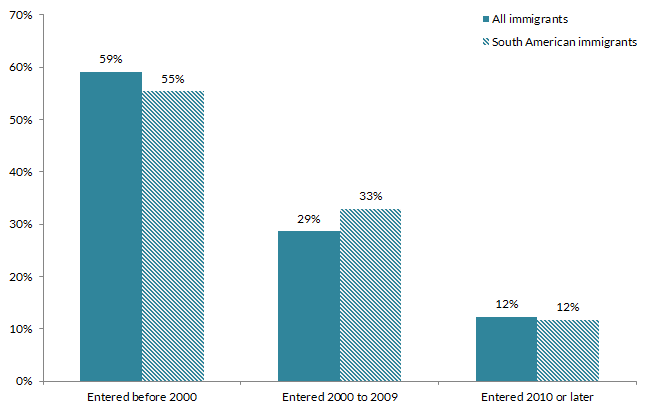
Source: MPI tabulation of data from the U.S. Census Bureau, 2014 ACS. Numbers may not add up to 100 as they are rounded to the nearest whole number.
Out of the 81,000 South American immigrants who obtained legal permanent residency in FY 2013—the latest data available—Colombia (21,000), Peru (13,000), and Brazil (11,000) were the top origins, accounting for 55 percent of new South American legal permanent residents (LPRs). The majority (80 percent) of South Americans gained green cards in 2013 through family ties: 55 percent as immediate relatives of U.S. citizens and 24 percent through family-sponsored preferences. In 2013, 5 percent of South Americans obtained green cards as refugees or asylees compared to 12 percent of all new LPRs, while just 1 percent of South Americans became permanent residents through the Diversity Visa Lottery (see Figure 6).
Figure 6. Immigration Pathways of South American Immigrants and All Immigrants in the United States, 2013

Notes: Family-sponsored: Includes adult children and siblings of U.S. citizens as well as spouses and children of green-card holders. Immediate relatives of U.S. citizens: Includes spouses, minor children, and parents of U.S. citizens. Diversity Visa Lottery: The Immigration Act of 1990 established the Diversity Visa (DV) Lottery to allow entry to immigrants from countries with low rates of immigration to the United States. The law states that 55,000 diversity visas in total are made available each fiscal year. Nationals of Brazil, Colombia, Ecuador, and Peru are not eligible for the DV-2017 lottery.
Source: MPI tabulation of data from Department of Homeland Security (DHS), 2013 Yearbook of Immigration Statistics (Washington, DC: DHS Office of Immigration Statistics, 2014), available online.
Despite moderate variations in immigration pathways by country of origin, family-based immigration was the primary channel for all South American immigrant groups, ranging from 45 percent of Venezuelan immigrants to 97 percent of those from Guyana. Around one-quarter to one-third of immigrants from Chile (22 percent), Brazil (25 percent), Argentina (30 percent), and Venezuela (31 percent) became green-card holders through employment sponsorship.
South American immigrants were slightly more likely to have private health insurance coverage (56 percent) and less likely to have public coverage (26 percent) than the overall foreign-born population (see Figure 7). They were almost as likely as the foreign born to be uninsured (26 percent versus 27 percent). About two-thirds of immigrants from Venezuela (65 percent) and Argentina (62 percent) were covered by private insurance, while sizable shares of those from Guyana (34 percent) and Ecuador (28 percent) had public coverage. At the same time, more than one-third of Uruguayans (42 percent) and Ecuadorans (35 percent) had no health insurance.
Figure 7. Health Coverage for South American Immigrants, All Immigrants, and the Native Born, 2014

Note: The sum of shares by type of insurance is likely to be greater than 100 because people may have more than one type of insurance.
Source: MPI tabulation of data from the U.S. Census Bureau, 2014 ACS.
Colombians represented the largest diaspora group among all South American populations in the United States. Approximately 1.2 million individuals were either born in Colombia or reported “Colombian Hispanic origin or ancestry” on the ACS. Ecuadorans (772,000) and Peruvians (723,000) comprised the second- and third-largest diasporas from South America in the United States (see Table 4).
Table 4. Estimates of the Top South American Diaspora Groups, 2010-14

Note: The term diaspora most often includes individuals born in the country as well as those who cited that origin as their ancestry, race, and/or ethnicity regardless of where they were born.
Source: MPI tabulation of data from the U.S. Census Bureau, 2010-14 ACS.
Remittances sent to South America grew rapidly starting in 1998, peaked in 2008, dropped sharply in 2009, and have remained relatively stable in the years since. Global remittances sent to South American countries via formal channels equaled nearly US $15 billion in 2015, representing only 0.3 percent of the region’s gross domestic product (GDP). For most South American countries, remittances accounted for a very small share of their GDP: around 0.1 percent in Venezuela, Argentina, Brazil, and Chile. In contrast, smaller economies in Guyana (10 percent), Ecuador (3 percent), and Paraguay (2 percent) were relatively more dependent on remittances.
Figure 8. Annual Remittance Flows to South America, 1970-2015

Source: MPI tabulations of data from the World Bank Prospects Group, “Annual Remittances Data,” October 2015 update.
Visit the Data Hub’s collection of interactive remittances tools, which track remittances by inflow and outflow, between countries, and over time.
Sources
Department of Homeland Security (DHS), Office of Immigration Statistics. 2014. 2013 Yearbook of Immigration Statistics. Washington, DC: DHS Office of Immigration Statistics. Available Online.
Gibson, Campbell J. and Kay Jung. 2006. Historical Census Statistics on the Foreign-born Population of the United States: 1850-2000. Working Paper No. 81, U.S. Census Bureau, Washington, DC, February 2006. Available Online.
Institute of International Education. 2015. Open Doors Report on International Educational Exchange. New York: IIE. Available Online.
U.S. Census Bureau. 2015. 2010-14 American Community Survey. Access from Steven Ruggles, Katie Genadek, Ronald Goeken, Josiah Grover, and Matthew Sobek. Integrated Public Use Microdata Series: Version 6.0 [Machine-readable database]. Minneapolis: University of Minnesota, 2015. Available Online.
U.S. Census Bureau. 2015. 2014 American Community Survey. American FactFinder. Available Online.
U.S. Department of State. N.d. Instructions for the 2017 Diversity Immigrant Visa Program (DV-2017). Accessed February 19, 2016. Available Online.
World Bank Prospects Group. 2015. Annual Remittances Data, October 2015 update. Available Online.