

European Immigrants in the United States

The German diaspora is the largest among all major European origin groups in the United States. (Photo: momentcaptured1/Flickr)
Once the backbone of U.S. immigration flows, European migration to the United States has steadily declined since 1960, with a small uptick following the end of communism in the 1990s. European immigrants numbered 4.8 million in 2014, out of a total immigrant population of 42.4 million. The share of Europeans among the total U.S. foreign-born population plunged from 75 percent in 1960 to 11 percent in 2014, as immigration from Latin America and Asia surged to new prominence after the Immigration Act of 1965 abolished national-origin quotas that gave preference to European migration.
The motivations and demographic composition of immigrants have changed over the long history of European migration to the United States. The first wave, between the 16th and 18th centuries, largely consisted of English-speaking settlers from the British Isles seeking economic opportunity and religious freedom. Considering the high costs of crossing the Atlantic, Europeans arriving in this era were a mix of well-to-do individuals and indentured servants.
From the 1840s to 1850s, the second wave witnessed the arrival of immigrants from Ireland, Germany, and Scandinavia escaping famine, religious persecution, and political conflicts. Compared to first-wave Protestant settlers, the new arrivals were overwhelmingly Catholic, came from much poorer backgrounds, and were more likely to be young and unskilled. Following this boom, European migration to the United States mostly paused during the Civil War.
More than 20 million immigrants arrived in the third wave (1880-1914). The new immigrants, primarily from Southern and Eastern Europe, were of different linguistic and religious backgrounds than earlier European arrivals. Most Southern European immigrants were motivated by economic opportunity in the United States, while Eastern Europeans (primarily Jews) sought protection from religious persecution. European immigration was slowed first by the outbreak of World War I in 1914, then by restrictive national-origin quotas established by the Immigration Act of 1924, which privileged individuals from Western and Northern Europe, and effectively halted immigration from Southern and Eastern Europe.
The most recent wave of European immigration followed the fall of the Iron Curtain in the early 1990s when a substantial number of Eastern Europeans moved to the United States to reunite with family members or seek humanitarian protection. The number of European immigrants in the United States has remained roughly the same since 2000 (see Figure 1).
Figure 1. European Immigrant Population in the United States, 1980-2014
![]()
Sources: Data from U.S. Census Bureau 2006, 2010, and 2014 American Community Surveys (ACS), and Campbell J. Gibson and Kay Jung, "Historical Census Statistics on the Foreign-born Population of the United States: 1850-2000" (Working Paper no. 81, U.S. Census Bureau, Washington, DC, February 2006), available online.
Of the 55.1 million European immigrants worldwide, the majority (63 percent) resided in other European countries, with the rest mostly in the United States and Canada, according to mid-2013 estimates by the United Nations Population Division. Click here to view an interactive map showing where migrants from each European country have settled worldwide.
The majority of European immigrants who have obtained lawful permanent residence in the United States (also known as receiving a “green card”) have done so as immediate relatives of U.S. citizens or through employment channels. Compared to the overall foreign- and native-born populations, European immigrants on average were significantly older, more educated, and had higher household incomes, though they were less likely to participate in the labor force.
Using data from the U.S. Census Bureau (the most recent 2014 American Community Survey [ACS] and pooled 2009-13 ACS data), the Department of Homeland Security’s 2013 Yearbook of Immigration Statistics, and the World Bank's annual remittance data, this Spotlight provides information on the European immigrant population in the United States, focusing on its size, geographic distribution, and socioeconomic characteristics.
Note: Socioeconomic characteristics of European immigrants from the following countries are based on pooled 2011-13 ACS data. This is due to the small sample sizes of these populations in the 2014 ACS and the limited availability of pooled 2012-14 ACS data. These countries include: Austria, Belarus, Belgium, Croatia, Czech Republic, Denmark, Finland, Latvia, Lithuania, Macedonia, Moldova, Norway, Serbia, Sweden, Switzerland, and the former Czechoslovakia, Soviet Union, and Yugoslavia.
Click on the bullet points below for more information:
- Distribution by European Region and Country of Origin
- Distribution by State and Key Cities
- English Proficiency
- Age, Education, and Employment
- Income and Poverty
- Immigration Pathways and Naturalization
- Health Coverage
- Diaspora
- Remittances
Distribution by European Region and Country of Origin
In 2014, Eastern Europe accounted for 44 percent (2.1 million) of all European immigrants in the United States (see Table 1). Western Europe (960,000) and Northern Europe (931,000) accounted for 20 percent each, followed by 16 percent from Southern Europe (775,000).
The top five countries of origin were the United Kingdom (679,000, or 14 percent), Germany (583,000, 12 percent), Poland (424,000, 9 percent), Russia (391,000, 8 percent), and Italy (357,000, 8 percent).
Table 1. Distribution of European Immigrants by Region and Top Country of Origin, 2014

Source: Migration Policy Institute (MPI) tabulation of data from the U.S. Census Bureau, 2014 ACS.
Between 1960 and 1990, the number of European immigrants steadily decreased (see Figure 2). Between 1990 and 2010, however, the number of Eastern European immigrants increased significantly due to a sizeable inflow from Eastern Europe after the dissolutions of Czechoslovakia, the Soviet Union, and Yugoslavia. Over the same period, the number of European immigrants from other parts of the continent continued to fall.
Figure 2. Number of European Immigrants in the United States, by Region of Birth, 1960-2014![]()
Note: The increase in Eastern European immigrants from 1990 to 2010 is noteworthy given that after the collapse of the Soviet Union (classified as Eastern Europe through 1990), the U.S. Census Bureau reclassified some former Soviet Republics such as Armenia and Kazakhstan as part of Asia. Source: Data from U.S. Census Bureau 2010 and 2014 American Community Surveys (ACS), and Gibson and Jung, "Historical Census Statistics.”
Click here for an interactive chart showing changes in the number of immigrants from Europe in the United States over time. Select individual European countries from the dropdown menu.
Distribution by State and Key Cities
Close to 40 percent of immigrants from Europe have settled in three states: New York (16 percent), California (14 percent), and Illinois (8 percent). The top four counties with European immigrants as of 2009-13 were Cook County in Illinois, Kings County in New York, Los Angeles County in California, and Queens County in New York. Together, these four counties accounted for about 16 percent of the total European immigrant population in the United States.
Figure 3. Top Destination States for European Immigrants in the United States, 2009-13

Note: Pooled 2009-13 ACS data were used to get statistically valid estimates at the state level for smaller-population geographies.
Source: MPI tabulation of data from U.S. Census Bureau pooled 2009-13 ACS.
Click here for an interactive map showing the geographic distribution of immigrants by state and county. Select individual European countries and regions from the dropdown menu to see which states and counties have the most European immigrants.
In the 2009-13 period, the U.S. cities with the largest number of European immigrants were the greater New York City, Chicago, and Los Angeles metropolitan areas. These three metropolitan areas accounted for 31 percent of the European-born population.
Figure 4. Top Metropolitan Destinations for European Immigrants in the United States, 2009-13
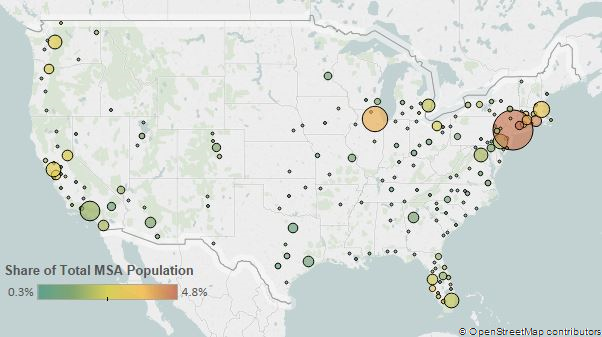
Note: Pooled 2009-13 ACS data were used to get statistically valid estimates at the metropolitan statistical-area level for smaller-population geographies.
Source: MPI tabulation of data from U.S. Census Bureau pooled 2009-13 ACS.
Click here for an interactive map highlighting the metropolitan areas with the highest concentrations of immigrants. Select individual European countries and regions from the dropdown menu to see which metropolitan areas have the most European immigrants.
Table 2. Top Concentrations by Metropolitan Area for the Foreign Born from Europe, 2009-13

Source: MPI tabulation of data from the U.S. Census Bureau pooled 2009-13 ACS.
European immigrants were much more likely to be both proficient in English and to speak English at home than the overall U.S. foreign-born population. In 2014, approximately 27 percent of European immigrants (ages 5 and over) were limited English proficient (LEP), compared to 50 percent of all foreign born. Immigrants from Eastern Europe were the most likely to be LEP (42 percent), followed by Southern Europe (38 percent) and Western Europe (11 percent), while Northern European immigrants were the least likely to be LEP (3 percent). The European-origin countries with the highest share of LEP individuals were Ukraine (53 percent), Moldova and Belarus (52 percent each), Bosnia and Herzegovina (47 percent), Albania (46 percent), and Portugal and Poland (45 percent each). European countries with the lowest share of LEP individuals included the United Kingdom and Ireland (2 percent each); Sweden (6 percent); Denmark (7 percent); the Netherlands (8 percent); and Belgium, Germany, and Norway (9 percent each).
Approximately 34 percent of all European immigrants spoke only English at home, versus 16 percent of all immigrants.
Note: Limited English proficiency refers to those who indicated on the ACS questionnaire that they spoke English less than “very well.”
Age, Education, and Employment
The European immigrant population was significantly older than the overall foreign- and native-born populations. The median age of European immigrants was 53 years—compared to 44 for the foreign born and 36 for the U.S. born. In 2014, European immigrants were more than twice as likely to be seniors (ages 65 and over) as either the foreign- or U.S.-born populations and less likely to be of working age (18 to 64, see Table 3). Immigrants from Eastern European countries including Bosnia and Herzegovina (90 percent), Bulgaria (86 percent), Macedonia (83 percent), and Albania (82 percent) were overwhelmingly of working age, while around half of those from Italy (51 percent), Latvia (50 percent), Austria (49 percent), and Hungary and Greece (48 percent each) were seniors.
Table 3. Age Distribution by Origin, 2014

Source: MPI tabulation of data from the U.S. Census Bureau, 2014 ACS. Numbers may not add up to 100 as they are rounded to the nearest whole number.
European immigrants on average had much higher educational attainment than both foreign- and native-born adults. Two-fifths (40 percent) of European adults had a bachelor’s degree or higher, compared to 29 percent of the total immigrant population and 30 percent of native-born adults. More than half of immigrants from Russia (62 percent); Bulgaria (61 percent); France (59 percent); Sweden (56 percent); Switzerland, Belarus, and Belgium (54 percent each); Lithuania and Ukraine (52 percent each); and Spain (50 percent) were college graduates, compared to less than one-quarter of those from Macedonia (24 percent), Italy (22 percent), Bosnia and Herzegovina (21 percent), and Portugal (13 percent). In 2014, only 13 percent of European immigrants (ages 25 and over) had not finished high school, compared to 30 percent of all immigrant adults and 10 percent of U.S.-born adults.
In school year (SY) 2014-15, the United Kingdom (10,743 international students), Germany (10,193), France (8,743), and Spain (6,143) were among the top 25 origin countries of the 975,000 international students studying at U.S. educational institutions. Between SY 2006-07 and SY 2014-15, international students from France (30 percent) experienced the highest growth rate among the four countries, followed by the United Kingdom (27 percent) and Germany (18 percent). Spain cracked the top 25 origin countries in SY 2011-12, and by SY 2014-15 had increased the number of international students it sent to the United States by 25 percent.
European immigrants participated in the labor force at a lower rate than the overall immigrant and native-born populations. In 2014, about 57 percent of European immigrants ages 16 and over were in the civilian labor force, compared to 66 percent and 62 percent of all foreign and native born, respectively.
Close to half (48 percent) of European immigrants were employed in management, business, science, and arts occupations, a much higher share than the overall foreign- and native-born populations (30 percent and 38 percent, respectively). Europeans were less likely to be employed in service occupations (16 percent); natural resources, construction, and maintenance occupations (8 percent); and production, transportation, and material-moving occupations (10 percent).
Figure 5. Employed Workers in the Civilian Labor Force (ages 16 and older) by Occupation and Origin, 2014
![]()
Source: MPI tabulation of data from the U.S. Census Bureau 2014 ACS.
While a sizable share of European immigrants were in management occupations, the primary occupation varied by country of origin: more than one-third of Albanian immigrants (35 percent) were employed in service occupations, while more than one-quarter of their peers from Bosnia and Herzegovina (27 percent) were in production, transportation, and material-moving occupations.
European immigrants had significantly higher incomes than the total foreign- and U.S.-born populations. In 2014, the median income of households headed by a European immigrant was $60,000, compared to $49,000 and $55,000 for overall immigrant and native-born households, respectively. Almost all European immigrant groups, except for those from Czechoslovakia, Hungary, Latvia, Moldova, and Ukraine, had higher median household incomes than the total foreign-born population. The highest median income among all European immigrant groups was reported in households headed by French ($81,000), Swedish ($79,000), and Danish ($76,000) immigrants.
Only 10 percent of European immigrants experienced poverty in 2014, less than the total immigrant population (19 percent) and native-born individuals (15 percent). Around 20 percent of immigrants from Moldova lived in poverty versus 7 percent of their peers from Austria, Bulgaria, Croatia, and Ireland.
Immigration Pathways and Naturalization
European immigrants were more likely than the total foreign-born population to be naturalized citizens. In 2014, 64 percent of the 4.8 million European immigrants residing in the United States had taken U.S. citizenship, compared to 47 percent of all immigrants. Immigrants from Latvia (78 percent) and Croatia (77 percent) had the highest naturalization rates, while those from Denmark (39 percent), Spain (42 percent), and Norway (43 percent) were the least likely to be naturalized.
The majority (70 percent) of Europeans entered the United States before 2000, a higher share than the overall immigrant population (see Figure 6). Approximately 20 percent of European immigrants arrived between 2000 and 2009, and 10 percent in 2010 or later. In contrast, a sizable share of Spanish (29 percent) and French (21 percent) immigrants arrived since 2010, compared to 4 percent of those from Bosnia and Herzegovina, Poland, and Portugal.
Figure 6. Immigrants from Europe and All Immigrants in the United States by Period of Arrival, 2014
![]()
Source: MPI tabulation of data from the U.S. Census Bureau, 2014 ACS. Numbers may not add up to 100 as they are rounded to the nearest whole number.
More than half (51 percent) of European immigrants who became legal permanent residents (LPRs) in FY 2013, the most recent data available, did so as immediate relatives of U.S. citizens, followed by 25 percent who qualified via employment-based preferences, and 12 percent who came through the Diversity Visa Lottery. European immigrants were much less likely to become LPRs via broader family-sponsored preferences (6 percent) or as refugees or asylees (5 percent) than the total LPR population (see Figure 7).
Figure 7. Immigration Pathways of European Immigrants and All Immigrants in the United States, 2013
![]()
Notes: Family-sponsored: Includes adult children and siblings of U.S. citizens as well as spouses and children of green-card holders. Immediate relatives of U.S. citizens: Includes spouses, minor children, and parents of U.S. citizens. Diversity Visa Lottery: The Immigration Act of 1990 established the Diversity Visa (DV) Lottery to allow entry to immigrants from countries with low rates of immigration to the United States. The law states that 55,000 diversity visas in total are made available each fiscal year. All European countries are eligible for the DV Lottery except nationals of Great Britain (Northern Ireland is treated separately and does qualify for the diversity program).
Source: MPI tabulation of data from the Department of Homeland Security (DHS), 2013 Yearbook of Immigration Statistics (Washington, DC: DHS Office of Immigration Statistics, 2014), available online.
While petitioning as immediate relatives of U.S. citizens was the primary pathway for all European groups in FY 2013, patterns of LPR channels varied by country. For instance, roughly half of immigrants from Iceland (55 percent), Finland and the Netherlands (49 percent each), France (47 percent), and the United Kingdom (46 percent) gained green cards via employment-based preferences. On the other hand, approximately 23 percent of new LPRs from Moldova qualified as refugees or asylees. A significant share of new Eastern European LPRs received their green cards through the Diversity Visa Lottery: Moldova (36 percent), Belarus (35 percent), Albania (29 percent), Bulgaria (28 percent), and Ukraine (23 percent).
European immigrants were more likely to have private (71 percent) and public (36 percent) health insurance coverage than both the foreign- and U.S.-born populations, and had a similar rate of uninsured as the U.S.-born population (see Figure 8). Immigrants from Lithuania and Macedonia (24 percent each), and Moldova (23 percent) were twice as likely as the overall European immigrant population to be uninsured.
Figure 8. Health Coverage for European Immigrants, All Immigrants, and the Native Born, 2014
![]()
Note: The sum of shares by type of insurance is likely to be greater than 100 because people may have more than one type of insurance.
Source: MPI tabulation of data from the U.S. Census Bureau, 2014 ACS.
According to tabulations from the U.S. Census Bureau’s 2013 ACS, around 15 percent of all U.S. residents, or 46.6 million individuals, either reported German ancestry or were born in Germany, making the German diaspora the largest among all major European origin groups (see Table 4). Ireland and the United Kingdom were also among the top diaspora groups, followed by Italy, Poland, and France.
Note: There is no universally recognized definition of the term "diaspora." Most often, the term includes individuals who self-identify as having ancestral ties to a specific country of origin.
Table 4. Estimates of the Top European Diaspora Groups, 2013

Notes: Ireland includes individuals who identified as Irish as well as Irish-Scotch and Scotch-Irish; the United Kingdom includes individuals who identified their ancestry as British, English, Scottish, Welsh, British Isles, or Anglo; and France excludes individuals who identified their ancestry as Basque.
Source: MPI tabulation of data from the U.S. Census Bureau, 2013 ACS.
Remittances sent to Europe have grown rapidly since 2000. Global remittances sent to European countries via formal channels equaled nearly US $146 billion in 2013, representing around 0.7 percent of the region’s gross domestic product (GDP). For most European countries, remittances accounted for a very small share of GDP: less than 0.5 percent in the Netherlands and Norway (0.2 percent each); and Russia, Ireland, Italy, and Greece (0.3 percent each). In contrast, economies in Moldova (25 percent), Bosnia and Herzegovina (11 percent), and Serbia and Albania (9 percent each) were more dependent on remittances.
Figure 9. Annual Remittance Flows to Europe, 1974-2014
![]()
Source: MPI tabulations of data from the World Bank Prospects Group, “Annual Remittances Data,” April 2015 update.
Visit the Data Hub’s collection of interactive remittances tools, which track remittances by inflow and outflow, between countries, and over time.
Sources
Department of Homeland Security (DHS), Office of Immigration Statistics. 2014. 2013 Yearbook of Immigration Statistics. Washington, DC: DHS Office of Immigration Statistics. Available Online.
Gibson, Campbell J. and Kay Jung. 2006. Historical Census Statistics on the Foreign-born Population of the United States: 1850-2000. Working Paper No. 81, U.S. Census Bureau, Washington, DC, February 2006. Available Online.
Glynn, Irial. 2011. Emigration Across the Atlantic: Irish, Italians and Swedes Compared, 1800-1950. European History Online, June 6, 2011. Mainz: Institute of European History (IEG). Available Online.
Institute of International Education. 2015. Open Doors, multiple years. Washington, DC: Institute of International Education.
Martin, Philip. 2013. The Global Challenge of Managing Migration. Population Bulletin 68 (2).
Martin, Susan. 2010. A Nation of Immigrants. Cambridge: Cambridge University Press.
U.S. Census Bureau. 2015. 2013 American Community Survey. Accessed from Steven Ruggles, Katie Genadek, Ronald Goeken, Josiah Grover, and Matthew Sobek. Integrated Public Use Microdata Series: Version 6.0 [Machine-readable database]. Minneapolis: University of Minnesota, 2015. Available Online.
---. 2015. 2014 American Community Survey. American FactFinder. Available Online.
U.S. Department of State. N.d. Instructions for the 2016 Diversity Immigrant Visa Program (DV-2016). Accessed October 6, 2015. Available Online.
World Bank Prospects Group. 2015. Annual Remittances Data, April 2015 update. Available Online.