

Immigrants from Asia in the United States

An Asian family in front of a store. (Photo: iStock.com/XiXinXing)
Migration from Asia to the United States has risen sharply since the mid-1960s, following the end of exclusionary immigration laws enacted in the late 19th and early 20th centuries that severely limited arrivals from countries across the Asian continent. With the passage of the 1965 Immigration and Nationality Act, the number of immigrants from Asian countries in the United States grew considerably. As of 2019, there were 14.1 million immigrants from Asia residing in the United States, representing a 29-fold increase from 1960. Today, people born on the continent of Asia account for 31 percent of the 44.9 million immigrants in the United States. This number refers to national origin, not race or ethnicity; while most immigrants from Asian countries identify as Asian, others describe themselves as White or as members of other racial groups.
Asia is the second-largest region of birth for U.S. immigrants, after the Americas, and since 2013 India and China have been the leading origin countries, displacing Mexico. Looking forward, arrivals from Asia are projected to comprise a greater share of all immigrants, becoming the largest foreign-born group by 2055, according to Pew Research Center estimates.
In 2019, India, China, and the Philippines were the top origin countries of immigrants from Asia. While the majority of pre-1965 immigrants from Asia were low-skilled laborers, the foreign born from the region today are more likely than the overall U.S.-born and immigrant populations to earn higher incomes, to work in management occupations, and to be highly educated, although these trends vary by country of origin.
Figure 1. Immigrant Population from Asia in the United States, 1960-2019
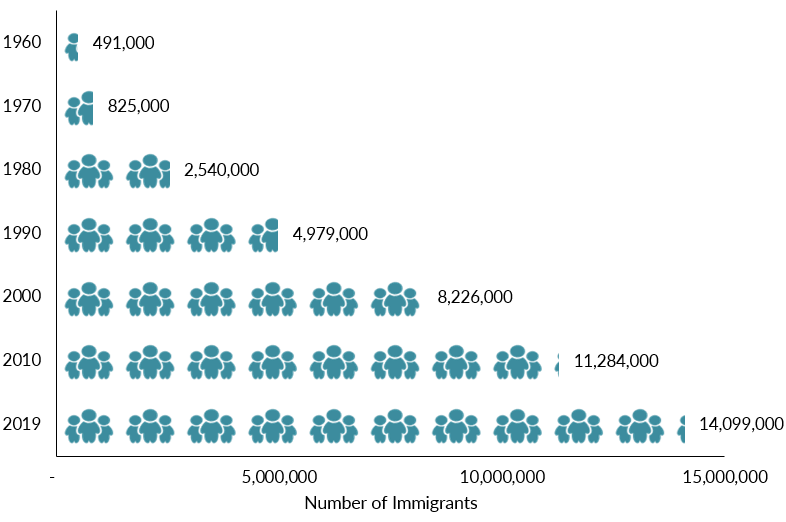
Source: Data from U.S. Census Bureau 2010 and 2019 American Community Surveys (ACS), and Campbell J. Gibson and Kay Jung, "Historical Census Statistics on the Foreign-born Population of the United States: 1850-2000" (Working Paper no. 81, U.S. Census Bureau, Washington, DC, February 2006), available online.
Of the 114.9 million migrants from Asia worldwide in mid-2020, 60 percent resided in other Asian countries. About 20 percent resided in Europe and another 15 percent in Northern America, according estimates from the United Nations Population Division.
Using data from the U.S. Census Bureau (the most recent 2019 American Community Survey [ACS] and pooled 2015-19 ACS data), the Department of Homeland Security’s Yearbook of Immigration Statistics, and the World Bank, this Spotlight provides information on the population of immigrants from Asia in the United States, focusing on its size, geographic distribution, and socioeconomic characteristics.
Click on the bullet points for more information on each topic:
- Distribution by Region and Country of Origin
- Distribution by State and Key Cities
- English Proficiency and Language Diversity
- Race and Ethnicity
- Age, Education, and Employment
- Income and Poverty
- Immigration Pathways and Naturalization
- Health Coverage
- Diaspora
- Remittances
Distribution by Region and Country of Origin
Asian migration to the United States, especially from South Eastern and Eastern Asia, grew rapidly between 1960 and 2019 (see Figure 2). The number of immigrants from South Central Asia also rose sharply since 2000, partly due to the inclusion of former Soviet Union countries (e.g., Uzbekistan and Kazakhstan) previously classified as Europe. Meanwhile, the number of Western Asian immigrants in the United States has grown steadily, but at a slower rate.
Figure 2. Immigrant Population from Asia in the United States, by Region of Birth, 1960-2019

Note: Individuals who reported an unclassified origin category were not included in the data, therefore the regional sum does not equal the total U.S. immigrant population born in Asia. Data may not be directly comparable between years due to changes in the U.S. Census Bureau’s classification system. Data for South Central and Western Asian immigrants in 2000, 2010, and 2019 include countries that were part of the former Soviet Union, which were previously classified as Europe.
Source: Data from U.S. Census Bureau 2010 and 2019 American Community Surveys (ACS), and Gibson and Jung, "Historical Census Statistics.”
In 2019, South Eastern Asia accounted for the largest share of the total Asian immigrant population (4.4 million), followed closely both South Central Asia (4.3 million) and Eastern Asia (4.2 million), and then by Western Asia (1.2 million, see Table 1).
The largest countries of origin were India (2.7 million, or 19 percent of Asian immigrants); China, including Hong Kong (2.5 million, 18 percent); the Philippines (2 million, 15 percent); Vietnam (1.4 million, 10 percent); and South Korea and North Korea (1 million, 7 percent), which the U.S. Census Bureau combines in its published data although the vast majority of the Korean Peninsula’s immigrants come from South Korea. Together, these countries accounted for almost 70 percent of the total Asian immigrant population in 2019. These countries were also among the top ten origin countries of all immigrants, representing one-fifth of the total U.S. foreign-born population. The Migration Information Source offers Spotlights for several Asian countries, including for immigrants in the United States from India, China, the Philippines, Vietnam, and Korea.
Table 1. Distribution of Immigrants from Asia in the United States by Region and Top Country of Origin, 2019

Source: Migration Policy Institute Policy (MPI) tabulation of data from the U.S. Census Bureau, 2019 ACS.
Click here for an interactive chart showing changes in the number of immigrants from Asia in the United States over time. Select individual Asian countries from the dropdown menu.
Distribution by State and Key Cities
Close to half (48 percent) of immigrants from Asia have settled in three states: California (30 percent), New York (9 percent), and Texas (8 percent). The top four counties with immigrants from Asia were Los Angeles, Santa Clara, and Orange in California, and Queens in New York. Together, these four counties accounted for about 19 percent of the total Asian immigrant population in the United States.
Figure 3. Top Destination States for Immigrants from Asia in the United States, 2015-19

Note: Pooled 2015-19 ACS data were used to get statistically valid estimates at the state level for smaller-population geographies. Not shown are the populations in Alaska and Hawaii; for details, visit the Migration Policy Institute (MPI) Migration Data Hub for an interactive map showing geographic distribution of immigrants by state and county, available online.
Source: MPI tabulation of data from U.S. Census Bureau pooled 2015-19 ACS.
In the 2015-19 period, the U.S. cities with the largest number of immigrants from Asia were the greater Los Angeles, New York, and San Francisco metropolitan areas. These three metro areas accounted for approximately 31 percent of the Asian-born population residing in the United States.
Figure 4. Top Metropolitan Destinations for Immigrants from Asia in the United States, 2015-19

Note: Pooled 2015-19 ACS data were used to get statistically valid estimates at the metropolitan statistical-area level for smaller-population geographies.
Source: MPI tabulation of data from U.S. Census Bureau pooled 2015-19 ACS.
Click here for an interactive map highlighting the metropolitan areas with the highest concentrations of immigrants. From the dropdown menu, select all of Asia or individual Asian regions and countries to see which metropolitan areas have the most Asian immigrants.
Table 2. Top Concentrations by Metropolitan Area for Immigrants from Asia, 2015-19

Source: MPI tabulation of data from the U.S. Census Bureau pooled 2015-19 ACS.
English Proficiency and Language Diversity
Compared to the overall foreign-born population, immigrants from Asia are more likely to be proficient in English but less likely to speak English at home.
In 2019, approximately 42 percent of immigrants from Asia (ages 5 and over) reported limited English proficiency, compared to 46 percent of all immigrants. Those from Eastern Asia were the most likely to be Limited English Proficient (LEP), at 53 percent, followed by immigrants from South Eastern Asia (45 percent), Western Asia (37 percent), and South Central Asia (29 percent). The Asian-origin countries with the highest share of LEP individuals were Myanmar (71 percent), Vietnam (65 percent), Laos (62 percent), and Uzbekistan and Cambodia (59 percent each). Asian-origin countries with the lowest share of LEP individuals were Israel (15 percent), India (22 percent), and Lebanon and the Philippines (28 percent each).
Approximately 13 percent of immigrants from Asia spoke only English at home in 2019, versus 16 percent of all immigrants. The top ten foreign languages spoken by Asian immigrants are Chinese (including Mandarin and Cantonese), Tagalog (including Filipino), Vietnamese, Korean, Hindi, Arabic, Urdu, Telugu, Persian (including Farsi and Dari), and Gujarati.
Note: Limited English proficiency refers to those who indicated on the ACS questionnaire that they spoke English less than “very well.”
For the most part, immigrants from Asia identify as Asian. More than 84 percent in 2019 reported their race as non-Latino Asian, followed by 12 percent who identified as non-Latino White. Smaller shares of immigrants from Asia reported other races: 3 percent as multi-racial, and less than 0.5 percent each reported being non-Latino Black, Latino, or unspecified race.
Among all immigrants, 44 percent reported being Latino, 27 percent non-Latino Asian, 17 percent non-Latino White, 9 percent non-Latino Black, 1 percent multiracial and less than 1 percent reported some other race.
Age, Education, and Employment
Like all immigrants, those from Asia are, on average, older than the native-born population. The median age of both Asian and all immigrants in 2019 was 46, compared to 37 for the U.S. born. In 2019, immigrants from Asia were more likely to be of working age (18 to 64,) and less likely to be under age 18 than the U.S.-born population (see Figure 5).
Most immigrants from Saudi Arabia (87 percent); Nepal (84 percent); Bangladesh (83 percent); Pakistan (82 percent); and India, Turkey, and Laos (81 percent each) were of working age. Meanwhile, approximately one-quarter of those from Iran (28 percent), Japan (25 percent), and the Philippines and Taiwan (24 percent each) were seniors (ages 65 and older).
Figure 5. Age Distribution by Origin, 2019

Source: MPI tabulation of data from the U.S. Census Bureau 2019 ACS.
Immigrants from Asia on average have much higher educational attainment than both all foreign- and U.S.-born adults. In 2019, only 14 percent of immigrant adults from Asia had not completed high school, compared to 26 percent of all immigrants and 8 percent of U.S.-born adults. In contrast, more than half (54 percent) of Asian adults ages 25 and over had a bachelor’s degree or higher in 2019, compared to 33 percent of both total immigrant and U.S.-born adults.
The majority of immigrants from India (79 percent), Taiwan (73 percent), the United Arab Emirates (70 percent), Turkey (61 percent), and Malaysia (60 percent) were college graduates, compared to less than one-quarter of those from Cambodia (19 percent) and Laos (15 percent). In addition, more than half of college-educated immigrants from China, India, Iran, Israel, Lebanon, Taiwan, and Turkey had an advanced degree.
Asia is the primary sending region of international students to the United States. In the 2019-20 school year, 835,000 students from Asia accounted for 78 percent of the 1.1 million international students enrolled in U.S. higher educational institutions. China (373,000), India (193,000), South Korea (50,000), and Saudi Arabia (31,000) were the top four origin countries of all international students, accounting for significant shares of the U.S. total (see Table 3). Over the past decade, the number of students from Asia in the United States has increased by 73 percent, with the largest increases coming from students from Oman (882 percent increase), Kuwait (243 percent increase), Bangladesh (237 percent increase), mainland China (192 percent increase), and Myanmar (163 percent increase).
Table 3. Number and Share of International Students in the United States from Top Asian-Origin Countries, 2019-20 School Year

Source: MPI tabulation of data from the Institute of International Education (IIE), "International Student Totals by Place of Origin, 2019/20," Open Doors: Report on International Educational Exchange (New York: IIE, 2020), available online.
Immigrants from Asia participate in the labor force at a slightly lower rate than the overall immigrant population, but a slightly higher rate than the native born. In 2019, about 65 percent of immigrants ages 16 and over from Asia were in the civilian labor force, compared to 67 percent and 62 percent of foreign- and U.S.-born individuals, respectively.
More than half (53 percent) of Asian immigrants were employed in management, business, science, and arts occupations—a much higher share than the overall foreign- and U.S.-born populations (see Figure 6). In contrast, immigrants from Asia were also much less likely to be employed in natural resources, construction, and maintenance occupations (3 percent).
Figure 6. Employed Workers in the Civilian Labor Force (ages 16 and older) by Occupation and Origin, 2019

Note: Percentages may not add up to 100 as they are rounded to the nearest whole number.
Source: MPI tabulation of data from the U.S. Census Bureau 2019 ACS.
Immigrants from most Asian countries were primarily employed in management-related occupations, with those from India and Taiwan having the highest shares in these occupations (76 percent and 71 percent, respectively). The largest shares of immigrant workers from Laos (37 percent), Myanmar (36 percent), and Cambodia (30 percent) were employed in production occupations, while one-third of Vietnamese workers were employed in service occupations.
Many immigrants from Asian countries, especially India, are employed in high-skilled jobs and enter the United States on temporary H-1B visas for specialty occupation workers. Of the 388,000 H-1B petitions approved in fiscal year (FY) 2019, 72 percent of beneficiaries were born in India, followed by mainland China (13 percent). A combined 2 percent of approved H-1B petitions went to beneficiaries from South Korea, the Philippines, and Taiwan.
Immigrants from Asia have significantly higher incomes than the total foreign- and U.S.-born populations. In 2019, the median income of households headed by an immigrant from Asia was $88,000, compared to $64,000 and $66,000 for overall immigrant and U.S.-born households, respectively. Households headed by immigrants from India ($132,000), Taiwan ($104,000), Malaysia and the Philippines ($99,000 each), and Israel ($93,000) had the highest median income among all immigrant groups from Asia, while Saudi ($37,000), Iraqi ($44,000), and Afghani ($47,000) households had the lowest median incomes.
In 2019, Asian immigrants were less likely than the overall U.S.-born and overall immigrant populations to be in poverty, with 11 percent of immigrants from Asia below the federal poverty level compared to 12 percent of U.S.-born individuals and 14 percent of immigrants. Immigrants from Saudi Arabia (34 percent), Afghanistan (29 percent), Iraq (26 percent), Jordan (24 percent), and Syria (21 percent) were the most likely to be in poverty.
Immigration Pathways and Naturalization
Immigrants from Asia are more likely than the overall foreign-born population to be naturalized citizens. As of 2019, 61 percent of the 14.1 million immigrants from Asia in the United States were U.S. naturalized citizens, compared to 52 percent of all immigrants. Immigrants from Cambodia (81 percent), Laos (80 percent), Taiwan and Lebanon (78 percent each), and Vietnam and Iran (76 percent each) had the highest naturalization shares, while those from Saudi Arabia (27 percent), Japan (34 percent), Nepal (36 percent), and Afghanistan (41 percent) were the least likely to be naturalized.
Asians on average are more likely than the total immigrant population to have entered the United States since 2010 (see Figure 7). Seventy-one percent of immigrants from Saudi Arabia entered in 2010 or later, as did more than half of those from Nepal (61 percent) and Afghanistan (60 percent), compared to less than 20 percent of immigrants from Vietnam (19 percent), combined South Korea and North Korea (18 percent), Cambodia (12 percent), Taiwan (17 percent), and Laos (6 percent).
Figure 7. Immigrants from Asia and All Immigrants in the United States by Period of Arrival, 2019

Note: Percentages may not add up to 100 as they are rounded to the nearest whole number.
Source: MPI tabulation of data from the U.S. Census Bureau 2019 ACS.
Of the more than 1 million individuals who obtained legal permanent residency (also known as getting a green card) in FY 2019, approximately 364,800 (35 percent) were from Asia. Mainland China (62,200), India (54,500), the Philippines (45,900), and Vietnam (39,700) were the among top 10 overall origin countries, accounting for 20 percent of all new legal permanent residents (LPRs).
New immigrants from Asia were most likely to obtain legal permanent residency as immediate relatives of U.S. citizens (40 percent; see Figure 8). Compared to all new LPRs, Asians were more likely to obtain green cards via employment-based preferences (21 percent versus 14 percent) or through family-sponsored preferences (24 percent versus 20 percent).
Figure 8. Immigration Pathways of All Legal Permanent Residents and Those from Asia in the United States, 2019

Notes: The family-sponsored preferences pathway includes adult children and siblings of U.S. citizens as well as spouses and children of green-card holders. Immediate relatives of U.S. citizens include spouses, minor children, and parents of U.S. citizens. The Diversity Visa lottery refers to the program established by the Immigration Act of 1990 to allow entry to immigrants from countries with low rates of immigration to the United States; the law states that 55,000 diversity visas in total are made available each fiscal year. Individuals from the following Asian countries were ineligible for the DV-2020 lottery: Bangladesh, China (mainland-born), India, Pakistan, the Philippines, South Korea, and Vietnam.
Source: MPI tabulation of data from Department of Homeland Security (DHS), 2019 Yearbook of Immigration Statistics (Washington, DC: DHS Office of Immigration Statistics, 2020), available online.
The channels through which immigrants from Asia gain LPR status vary significantly by country. For instance, more than half of new LPRs from South Korea (57 percent), Oman (57 percent), and Singapore (55 percent) obtained green cards in FY 2019 via employment-based preferences. On the other hand, most immigrants from Laos (83 percent), North Korea (79 percent), Cambodia (70 percent), and Thailand (67 percent) became LPRs as immediate relatives of U.S. citizens. The Diversity Visa program was the main pathway to a green card for immigrants from Tajikistan (72 percent), Azerbaijan (55 percent), and Turkmenistan (50 percent). A significant share of new LPRs from Bhutan (94 percent), Syria (77 percent), Myanmar (66 percent), and Iraq (63 percent) attained permanent residency by adjusting from refugee or asylee status.
Although most arrive via legal channels, immigrants from Asia represent a significant and growing portion of the unauthorized immigrant population. In the 2014-18 period, approximately 1.5 million unauthorized immigrants from Asia resided in the United States, according to Migration Policy Institute (MPI) estimates, representing 14 percent of the estimated 11 million unauthorized immigrants. India is the fourth-largest origin country of unauthorized immigrants, accounting for an estimated 4 percent of the total.
Click here to view an interactive map showing the number and geographic distribution (by state and county) of unauthorized immigrants from India and other top origin countries. Click here to view demographic information about unauthorized immigrants nationwide, in most states, and in select counties.
MPI estimated that approximately 110,300 youth and young adults from Asia were immediately eligible for the Deferred Action for Childhood Arrivals (DACA) program in 2020, which provides temporary relief from deportation as well as work authorization. As of December 31, 2020 (the latest data available from the U.S. government), 636,400 unauthorized youth and young adults had active DACA status, including immigrants from South Korea (6,030), the Philippines (3,190), India (2,150), Pakistan (1,110), and Indonesia (630).
Click here to view the top origin countries of DACA recipients and their U.S. states of residence.
Immigrants from Asia were more likely to have private health insurance coverage (70 percent) and less likely to be uninsured (8 percent) than the overall foreign-born population in 2019 (58 percent and 20 percent, respectively; see Figure 9).
Most Japanese and Indian immigrants (84 percent each) were covered by private insurance. Significant shares of those from Afghanistan (60 percent), Iraq (55 percent), Syria (53 percent), Armenia (47 percent), Uzbekistan (46 percent), Myanmar (43 percent), and Bangladesh (42 percent) had public coverage. Immigrants from Jordan (17 percent), and Nepal, Myanmar, and Iraq (15 percent apiece) were nearly twice as likely to be uninsured as all immigrants from Asia.
Figure 9. Health Coverage for Immigrants from Asia, All Immigrants, and the Native Born, 2019

Note: The sum of shares by type of insurance is likely to be greater than 100 because people may have more than one type of insurance.
Source: MPI tabulation of data from the U.S. Census Bureau 2019 ACS.
The Chinese diaspora is the largest among all Asian-origin countries in the United States and ninth of all diaspora groups, according to MPI’s tabulation of data from the U.S. Census Bureau’s 2019 ACS. Approximately 5.5 million individuals were either born in China or reported Chinese ancestry, followed by the Indian and Filipino diasporas (see Table 5).
Table 4. Estimates of Top Asian Diaspora Groups in the United States, 2019

Notes: The term diaspora includes individuals born in the country as well as those who cited that origin as their ancestry, race, and/or ethnicity regardless of where they were born. Ancestry refers to a person’s ethnic origin or descent, “roots,” or heritage; or the place of birth of the person, the person's parents, or ancestors before their arrival in the United States. Diaspora figures may overlap for some groups. Country of birth estimate for China includes Hong Kong and Macao, but not Taiwan. Diaspora estimate excludes persons reporting "Taiwanese alone" ancestry.
Source: MPI tabulation of data from the U.S. Census Bureau 2019 ACS.
Click here to view the top 20 diaspora groups in the United States.
Global remittances sent to Asian countries via formal channels equaled nearly U.S. $342 billion in 2020, according to the World Bank’s estimates. For most Asian countries, remittances represent a very small share relative to their Gross Domestic Product (GDP): less than 0.1 percent in Japan, Kuwait, Maldives, Oman, Saudi Arabia, and Turkmenistan. In contrast, economies in Lebanon (36 percent), Tajikistan (26 percent), Kyrgyzstan (25 percent), Nepal (23 percent), and Yemen (19 percent) were more dependent on remittances.
Similar to global remittances, which fell by 7 percent between 2019 and 2020 due to the COVID-19 pandemic, remittance inflows to Asian countries fell by 8 percent. The decline was much more pronounced in several Asian countries, including Armenia (where remittances fell 25 percent), Kyrgyzstan (22 percent), Uzbekistan and the West Bank and Gaza (both 20 percent), and Indonesia (16 percent).
Figure 10. Annual Remittance Flows to Asia, 1990 to 2020

Note: The 2020 figure represents World Bank projections for 2020.
Source: MPI tabulations of data from the World Bank Prospects Group, “Annual Remittances Data,” October 2020 update.
Visit the Data Hub’s collection of interactive remittances tools, which track remittances by inflow and outflow, between countries, and over time.
Sources
Gibson, Campbell J. and Kay Jung. 2006. Historical Census Statistics on the Foreign-born Population of the United States: 1850-2000. Working Paper No. 81, U.S. Census Bureau, Washington, DC, February 2006. Available Online.
Institute of International Education (IIE). 2020. Open Doors: Report on International Educational Exchange. New York: IIE. Available Online.
Pew Research Center. 2015. Modern Immigration Wave Brings 59 Million to U.S., Driving Population Growth and Change Through 2065. Washington, DC: Pew Research Center. Available Online.
United Nations Department of Economic and Social Affairs, Population Division. 2020. International Migrant Stock 2020. Accessed March 1, 2021. Available online.
U.S. Census Bureau. N.d. 2019 American Community Survey. Accessed March 1, 2021. Available online.
---. 2020. 2019 American Community Survey. Access from Steven Ruggles, Katie Genadek, Ronald Goeken, Josiah Grover, and Matthew Sobek. Integrated Public Use Microdata Series: Version 10.0 [dataset]. Minneapolis: University of Minnesota, 2020. Available online.
U.S. Citizenship and Immigration Services (USCIS). 2020. Characteristics of H-1B Specialty Occupation Workers, Fiscal Year 2019 Annual Report to Congress. Washington, DC: USCIS. Available Online.
---. 2020. Approximate Active DACA Recipients: As of September 30, 2020. Available Online.
U.S. Department of Homeland Security (DHS), Office of Immigration Statistics. 2020. 2019 Yearbook of Immigration Statistics. Washington, DC: DHS Office of Immigration Statistics. Available Online.
U.S. Department of State. N.d. Instructions for the 2020 Diversity Immigrant Visa Program (DV-2020). Available Online.
World Bank Group. 2020. Annual Remittances Data, October 2020 update. Available Online.