Largest U.S. Immigrant Groups over Time, 1960-Present
Largest U.S. Immigrant Groups over Time, 1960-Present
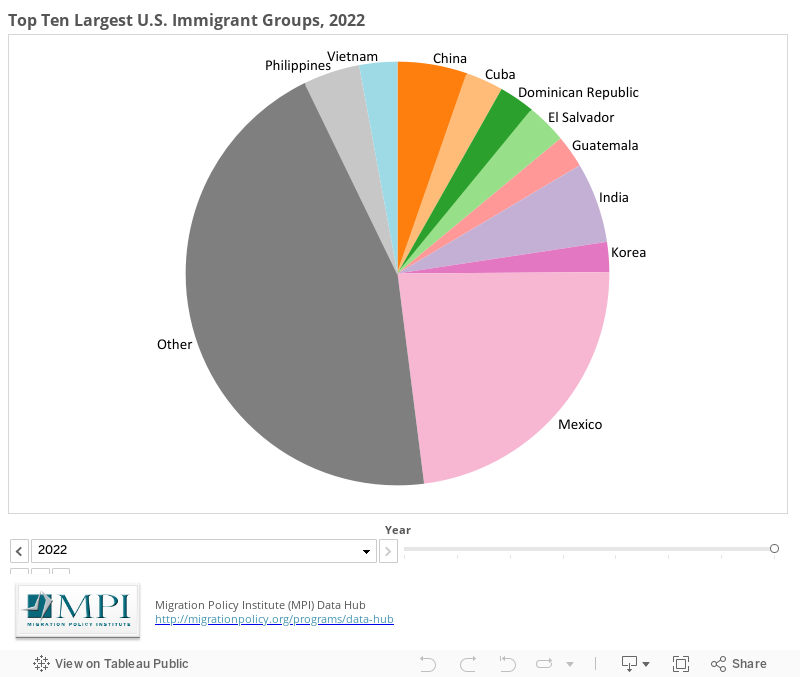
While the U.S. immigrant population is diverse, just a few countries of origin make up a large share of the total. This pie chart series shows which countries had the largest immigrant populations at various time periods between 1960 and 2022 (use the slider to select different years). For countries not in the top ten, the immigrant population is aggregated in the "other countries" category. The growth of this category over time indicates that the immigrant population comes from increasingly diverse national origins.
1) The term "immigrants" (also known as the foreign born) refers to people residing in the United States who were not U.S. citizens at birth. This population includes naturalized citizens, lawful permanent residents (LPRs), certain legal nonimmigrants (e.g., persons on student or work visas), those admitted under refugee or asylee status, and persons illegally residing in the United States.
2) In this tool, the figure for China excludes Hong Kong in 1990. From 2000 on, the figure for China includes Hong Kong. Taiwan is not included in the figure for China in any year. Click on the “Get the Data” button below to view the number of immigrants from Hong Kong and Taiwan across years.
3) The U.S. Census Bureau experienced significant challenges collecting data in 2020 due to the COVID-19 pandemic and released only a small number of data points from its 2020 American Community Survey (ACS), which it called “experimental.” This data tool does not include estimates from the 2020 ACS.
Migration Policy Institute (MPI) tabulation of data from U.S. Census Bureau, 2010, 2019, and 2022 American Community Surveys (ACS), and 2000 Decennial Census; data for 1960 to 1990 are from Campbell J. Gibson and Emily Lennon, "Historical Census Statistics on the Foreign-Born Population of the United States: 1850 to 1990" (Working Paper No. 29, U.S. Census Bureau, Washington, DC, 1999).