This bar chart displays the immigrant population in the United States, between 1960 and 2022, by region of birth. The chart demonstrates the major shift in origins—from mostly European to predominantly Latin American and Asian, and more recently African—that occurred as a result of significant changes in U.S. immigration and refugee laws, the growing U.S. economic and military presence in Asia and Latin America, and economic transformations and political instability in key sending countries.
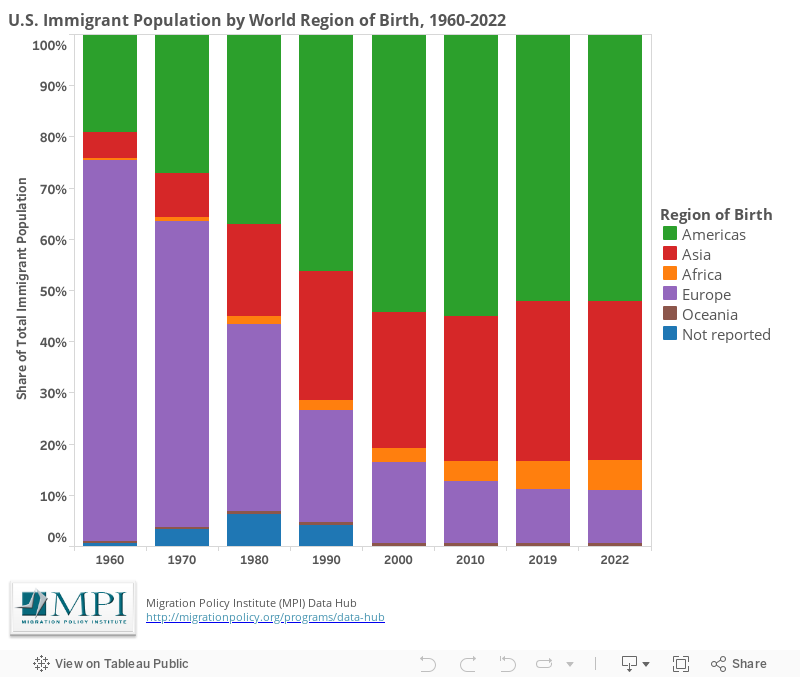
Migration Policy Institute (MPI) tabulation of data from U.S. Census Bureau, 2010, 2019, and 2022 American Community Surveys (ACS), and 2000 Decennial Census; data for 1960 to 1990 were from Campbell J. Gibson and Emily Lennon, "Historical Census Statistics on the Foreign-Born Population of the United States: 1850-1990" (Working Paper No. 29, U.S. Census Bureau, Washington, D.C., February 1999).