

Middle Eastern and North African Immigrants in the United States

The Middle Eastern and North African immigrant population in the United States topped 1 million in 2013. Iraq, Egypt, and Lebanon are the largest origin countries from the region (Photo: yooperann/Flickr)
As of 2013, approximately 1.02 million immigrants from the Middle East and North Africa (MENA) region resided in the United States, representing 2.5 percent of the nation’s 41.3 million immigrants. Migration from the MENA region to the United States, motivated mainly by political instability in the region and economic opportunities abroad, began in the 18th century and has occurred in three phases.
The first wave (late 1800s to mid-1920s) overwhelmingly consisted of Arab Christians from the Ottoman province of Syria (today’s Lebanon, Israel/Palestine, and Syria) fleeing wars and declining economic prospects. In 1920, the United States was home to at least 50,000 immigrants from this region. Arrivals were largely uneducated and mostly employed in low-skill occupations. The Johnson-Reed Immigration Act of 1924, which established general immigration quotas and restricted all immigration from Asia, effectively ended this wave.
|
The Middle East and North Africa
|
|
|
The second wave (1948 to 1965) was triggered by political unrest in the MENA region, including the 1948 Arab-Israeli War and revolutions in Egypt and Iraq in the 1950s. Partly as a result of the restrictive U.S. quota system, immigrants who arrived during this period were highly educated elites from countries such as Egypt, Iraq, and Syria.
The removal of the quota system with the Immigration and Nationality Act of 1965 opened the door to the third wave—a mix of people seeking family reunification, education and employment opportunities, and safety from war and persecution. Post-1965 MENA immigrants had a similar level of education to those in the second wave, but were far more numerous. And a much higher percentage was Muslim. Between 1980 and 2010, the size of the MENA immigrant population increased four-fold, from 223,000 to 861,000; and between 2010 and 2013 increased a further 18 percent, to 1,017,000.
|
Figure 1. MENA Immigrant Population in the United States, 1980-2013
|
|
Sources: Data from U.S. Census Bureau 2006, 2010, and 2013 American Community Surveys (ACS), and Campbell J. Gibson and Kay Jung, "Historical Census Statistics on the Foreign-born Population of the United States: 1850-2000" (Working Paper no. 81, U.S. Census Bureau, Washington, DC, February 2006), www.census.gov/population/www/documentation/twps0081/twps0081.html. |

Of the total 16.1 million MENA immigrants worldwide, close to half (45 percent or 7.2 million) have migrated within the MENA region. Beyond the region, France (2.8 million), the United States (904,000), Spain (825,000), and Italy (703,000) are the top destinations, according to mid-2013 estimates by the United Nations Population Division. The international settlement pattern of each country’s immigrants is very different. For instance, more than 80 percent of Algerian immigrants resided in France, while only 1 percent was in the United States. In contrast, close to one-third of Lebanese immigrants resided in the United States and Canada, while 7 percent were in France. Click here to view an interactive map showing where migrants by country and region have settled worldwide.
The current MENA immigrant population in the United States is very diverse: approximately 70 percent come from the Middle East, the remainder from North Africa (see Table 1). Iraq is the largest country of origin, followed closely by Egypt and Lebanon. The number of immigrants from Saudi Arabia and Yemen has also grown rapidly over the past decade. There was no noticeable increase in the number of Syrians entering the United States as refugees between 2011 and 2013 as the Syrian civil war intensified, most likely due to the lag in time between application and approval for resettlement. However, there was a marked uptick in Syrians granted asylum in the United States, from 60 in 2011 to 364 in 2012 and 811 in 2013. Most Syrians who have fled their war-torn country reside in camps in neighboring countries, many waiting to be resettled.
|
Table 1. Distribution of MENA Immigrants by Country of Origin, 2013
|
|
Source: Migration Policy Institute (MPI) tabulation of data from U.S. Census Bureau, 2013 ACS. |

Click here for an interactive chart showing changes in the number of immigrants from the MENA region in the United States over time. Select individual MENA countries from the dropdown menu.
Close to two-fifths of MENA immigrants obtain lawful permanent residence in the United States (also known as receiving a “green card”) as immediate relatives of U.S. citizens. The remainder qualifies through humanitarian channels and family-sponsored preferences. Compared to the overall foreign- and native-born populations, MENA immigrants on average are significantly higher educated, but are much less likely to be employed, and have lower household incomes. Although many MENA countries share similar religious and linguistic backgrounds, there are great variations in socioeconomic characteristics among different MENA immigrant groups in the United States.
Using data from the U.S. Census Bureau (the most recent 2013 American Community Survey [ACS] and pooled 2009-13 ACS data), the Department of Homeland Security’s Yearbook of Immigration Statistics, and the World Bank's annual remittance data, this Spotlight provides information on the Middle Eastern and Northern African immigrant population in the United States, focusing on its size, geographic distribution, and socioeconomic characteristics.
|
Definitions
|
|
|
Click on the bullet points below for more information:
- Distribution by State and Key Cities
- Language Diversity and English Proficiency
- Age, Education, and Employment
- Income and Poverty
- Immigration Pathways and Naturalization
- Health Coverage
- Diaspora
- Remittances
Distribution by State and Key Cities
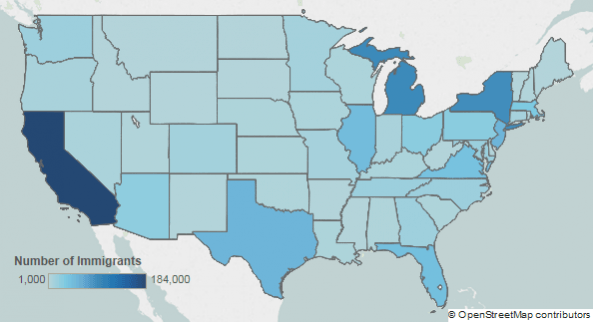
Most immigrants from the MENA region have settled in California (20 percent), Michigan (11 percent), and New York (10 percent). The top four counties with MENA immigrants in 2009-13 were Los Angeles County in California, Wayne County in Michigan, Cook County in Illinois, and Kings County in New York. Together, these four counties accounted for about 19 percent of the total MENA immigrant population in the United States.
|
Figure 2. Top Destination States for MENA Immigrants in the United States, 2009-13
|
|
Note: Pooled 2009-13 ACS data were used to get statistically valid estimates at the state level for smaller-population geographies. |
Click here for an interactive map that shows the geographic distribution of immigrants by state and county. Select individual MENA countries from the dropdown menu to see which states and counties have the most MENA immigrants.
In the 2009-13 period, the U.S. cities with the largest number of MENA immigrants were the greater New York City, Los Angeles, and Detroit metropolitan areas. These three metropolitan areas accounted for about one-third of MENA immigrants in the United States.
|
Figure 3. Top Metropolitan Destinations for MENA Immigrants in the United States, 2009-13
|
|
Note: Pooled 2009-13 ACS data were used to get statistically valid estimates at the metropolitan statistical-area level for smaller-population geographies. |

|
Table 2. Top Concentrations by Metropolitan Area for the Foreign Born from the MENA Region, 2009-13
|
|
Source: MPI tabulation of data from the U.S. Census Bureau pooled 2009-13 ACS. |

Click here for an interactive map that highlights the metropolitan areas with the highest concentrations of immigrants. Select individual MENA countries from the dropdown menu to see which metropolitan areas have the most MENA immigrants.
Language Diversity and English Proficiency
Of all MENA immigrants, more than two-thirds spoke Arabic. MENA immigrants were more likely to be proficient in English than the overall U.S. foreign-born population but less likely to speak only English at home. In 2013, around 40 percent of MENA immigrants (ages 5 and over) reported limited English proficiency (LEP), compared to 50 percent of all foreign born. Approximately 12 percent of MENA immigrants spoke only English at home, versus 16 percent of all immigrants. English proficiency varied significantly by country of origin: less than 20 percent of immigrants from Kuwait and the United Arab Emirates (UAE) were LEP, versus 63 percent of Yemeni immigrants.
Note: Limited English proficiency refers to those who indicated on the ACS questionnaire that they spoke English less than “very well.”
Age, Education, and Employment
The MENA immigrant population was younger than the overall foreign-born population but older than the native-born population. The median age of MENA immigrants was 40 years—compared to 43 for all foreign born and 36 for native born.In 2013, 80 percent of MENA immigrants were of working age (18 to 64), 12 percent were ages 65 and over, and 9 percent were under 18. In comparison, 80 percent of all foreign born in the United States were of working age, versus 60 percent of the native-born population.
|
Table 3. Age Distribution by Origin, 2013
|
|
Source: MPI tabulation of data from the U.S. Census Bureau, 2013 ACS. |

Middle Eastern and North African immigrants tend to have much higher educational attainment compared to the overall foreign- and native-born adult populations. In 2013, 43 percent of MENA immigrants (ages 25 and over) had a bachelor’s degree or higher, compared to 28 percent of all immigrants and 30 percent of native-born adults. Saudi Arabia was the fourth largest origin country of international students in the United States in the 2013-14 school year, after China, India, and South Korea, accounting for 6 percent (or 54,000) of the total 820,000 international students that year. Almost all immigrant-origin groups from the MENA region were more likely to be college educated than the overall foreign-born population, with the exception of Yemeni immigrants. Immigrants from Egypt, Libya, Saudi Arabia, and the United Arab Emirates were the most educated—more than two-thirds had finished college, while only 11 percent of those from Yemen had a bachelor’s degree or beyond.
|
Quick Facts on Syrian Immigrants
|
|
|
Immigrants from the MENA region, especially women, participated in the U.S. labor force at a much lower rate than the overall immigrant and native-born populations. In 2013, about 58 percent of MENA immigrants ages 16 and over were in the civilian labor force, compared to 67 percent and 63 percent of the total foreign- and native-born populations, respectively. Meanwhile, approximately 44 percent of female MENA immigrants were in the civilian labor force, compared to the overall female foreign-born (56 percent) and U.S.-born (59 percent) populations, possibly attributable to the conservative culture of many Muslim countries. Male MENA immigrants in general participated in the civilian labor force (70 percent) at a rate similar to the total foreign-born population with a notable exception—only around 28 percent of male immigrants from Saudi Arabia were in the U.S. civilian labor force.
MENA immigrants were more likely to be employed in management, business, science, and arts occupations (41 percent) and sales and office occupations (26 percent) than both the overall foreign-born (30 percent and 17 percent) and native-born (38 percent and 26 percent) populations.
|
Figure 4. Employed Workers in the U.S. Civilian Labor Force (ages 16 and older) by Occupation and Origin, 2013
|
|
Source: MPI tabulation of data from the U.S. Census Bureau 2013 ACS. |

More than half of employed immigrants from Egypt, Kuwait, Lebanon, Libya, Saudi Arabia, and the United Arab Emirates worked in management, business, science, and arts occupations, while more than half of employed Yemeni immigrants were in sales and office occupations.
MENA immigrants had lower incomes compared to the total foreign- and U.S.-born populations. In 2013, the median income of households headed by an immigrant from the MENA region was $43,000, compared to $48,000 and $53,000 for total foreign- and native-born households, respectively.
In 2013, 30 percent of MENA immigrants lived in poverty, a much higher rate compared to both the total immigrant (19 percent) and native-born populations (15 percent).
Immigration Pathways and Naturalization
Immigrants from the Middle East and North Africa were more likely than the total foreign-born population to be naturalized citizens. In 2013, 57 percent of the 1 million MENA immigrants residing in the United States were naturalized U.S. citizens, compared to 47 percent of all immigrants. Approximately three-quarters of immigrants from Jordan and Lebanon were naturalized, versus only 16 percent of Saudi Arabian immigrants—the lowest among all MENA countries.
MENA immigrants were more likely to have entered the United States since 2010 than the overall immigrant population, as Figure 5 shows. Less than half of MENA immigrants (47 percent) arrived prior to 2000, followed by 30 percent who arrived between 2000 and 2009, and 23 percent in 2010 or later. The majority of immigrants from Lebanon (71 percent), Jordan (61 percent), Syria (60 percent), and Algeria (60 percent) entered before 2000, close to half of UAE immigrants (46 percent) entered between 2000 and 2009, while a sizable portion of Libyan (38 percent) and Iraqi (32 percent) immigrants entered in 2010 or later. Interestingly, close to 64 percent of immigrants from Saudi Arabia have entered the United States since 2010.
|
Figure 5. Immigrants from the MENA Region and All Immigrants in the United States by Period of Arrival, 2013
|
|
Source: MPI tabulation of data from the U.S. Census Bureau 2013 ACS. Numbers may not add up to 100 as they are rounded to the nearest whole number. |

The most common pathway (38 percent) to legal permanent residence (LPR) for immigrants from the MENA region was as immediate relatives of U.S. citizens. MENA immigrants were more likely to gain green cards via the refugee and asylum channel (25 percent) and Diversity Visa lottery pathway (12 percent) than the total LPR population (see Figure 6).
|
Figure 6. Immigration Pathways of MENA Immigrants and All Immigrants in the United States, 2013
|
|
Notes: Family-sponsored: Includes adult children and siblings of U.S. citizens as well as spouses and children of green-card holders. Immediate relatives of U.S. citizens: Includes spouses, minor children, and parents of U.S. citizens. Diversity Visa Lottery: The Immigration Act of 1990 established the Diversity Visa (DV) Lottery to allow entry to immigrants from countries with low rates of immigration to the United States. The law states that 55,000 diversity visas in total are made available each fiscal year. |

Although petitioning as immediate relatives of U.S. citizens was the primary pathway for MENA immigrants in fiscal year (FY) 2013, the immigration pattern varied by country. For instance, 71 percent of Iraqi immigrants and 49 percent of Sudanese immigrants became LPRs as refugees and asylees, while 51 percent of Algerian immigrants gained green cards through the Diversity Visa lottery. Thirty-five percent of UAE immigrants became permanent residents via employment-based preferences, and 30 percent of Jordanian immigrants through family-sponsored preferences.
MENA immigrants were more than twice as likely as the U.S.-born population (12 percent) to be uninsured (25 percent), but much less likely to be uninsured compared to the overall immigrant population (32 percent). They were as likely as the native-born population to have public health insurance (33 percent) and almost as likely as the foreign-born population to have private health insurance (48 percent). Iraqi immigrants, most of who came to the United States as refugees or on Special Immigrant Visas (SIV), which entitle recipients to certain social benefits, had the highest share of public health insurance coverage (52 percent) among all MENA countries.
|
Figure 7. Health Coverage for MENA Immigrants, All Immigrants, and the U.S. Born, 2013
|
|
Note: The sum of shares by type of insurance is likely to be greater than 100 because people may have more than one type of insurance. |

The Middle Eastern and North African diaspora population in the United States is comprised of approximately 2.03 million individuals who were either born in the MENA region or reported MENA ancestry, according to tabulations from the U.S. Census Bureau 2013 ACS.
Note: There is no universally recognized definition of the term "diaspora." Most often, the term includes individuals who self-identify as having ancestral ties to a specific country of origin. The MENA diaspora in the United States includes all individuals who were born in a MENA country or who selected at least one of the following responses on the two ACS questions about ancestry: Algerian, Arab, Arabic, Assyrian, Bahraini, Chaldean, Egyptian, Iraqi, Jordanian, Kuwaiti, Lebanese, Libyan, Middle Eastern, Moroccan, North African, Omani, Other Arab, Qatari, Saudi Arabian, South Yemeni, Syrian, Tunisian, United Arab Emirates, or Yemeni.
Global remittances sent to MENA countries via formal channels equaled nearly US $70 billion in 2013, representing less than 4 percent of the region’s gross domestic product (GDP). Remittances sent to the MENA region have seen a five-fold increase since 1990.
|
Figure 8. Annual Remittance Flows to MENA Countries, 1975-2014
|
|
Source: MPI tabulations of data from the World Bank Prospects Group, “Annual Remittances Data,” April 2015 update. |

Visit the Data Hub’s collection of interactive remittances tools, which track remittances by inflow and outflow, between countries, and over time.
Sources
Department of Homeland Security (DHS), Office of Immigration Statistics. 2014. 2013 Yearbook of Immigration Statistics. Washington, DC: DHS Office of Immigration Statistics. Available Online.
Foad, Hisham S. 2013. Waves of Immigration from the Middle East to the United States. Social Science Research Network, December 2013. Available Online.
Gibson, Campbell J. and Kay Jung. 2006. Historical Census Statistics on the Foreign-born Population of the United States: 1850-2000. Working Paper no. 81, U.S. Census Bureau, Washington, DC, February 2006. Available Online.
Institute of International Education. 2014. Open Doors 2014. Washington, DC: Institute of International Education. Available Online.
Orfalea, Gregory. 2006. The Arab Americans: A History. Northampton, MA: Olive Branch Press.
U.S. Census Bureau. 2013. 2013 American Community Survey (ACS). American FactFinder. Available Online.
---. 2010. 2013 American Community Survey. Accessed from Steven Ruggles, J. Trent Alexander, Katie Genadek, Ronald Goeken, Matthew B. Schroeder, and Matthew Sobek. Integrated Public Use Microdata Series: Version 5.0 [Machine-readable database]. Minneapolis: University of Minnesota, 2010. Available Online.
U.S. Citizenship and Immigration Services (USCIS). 2015. Characteristics of H-1B Specialty Occupation Workers: Fiscal Year 2014. Washington, DC: USCIS. Available Online.
---. 2015. Deferred Action for Childhood Arrivals Process (Through Fiscal Year 2015, 1st Qtr). Washington, DC: USCIS, January 2015. Available Online.
World Bank Prospects Group. 2015. Annual Remittances Data, April 2015 update. Available Online.