

Immigrants in the United States and the Current Economic Crisis
The current U.S. recession is already longer than all but two since World War II and deeper than any since the Great Depression. And an avalanche of increasingly dismal economic assessments from most parts of the world points to the global economic crisis deepening during 2009 and possibly beyond.
Before 2007, the U.S. economy had grown in 23 of the past 25 years. During this period of sustained economic growth, the United States attracted record numbers of new immigrants. The U.S. foreign-born population quadrupled from 9.6 million in 1970 to about 38.1 million in 2007.
More than 1 million immigrants have entered the United States legally each year for much of the past decade. About another half a million have typically entered illegally each year.
Immigration flows to the United States have noticeably slowed in the last year, raising fundamental questions for policymakers and analysts about the effect the current economic crisis is having on inflows and return migration. These questions appear particularly daunting because there has been no comparable crisis in recent memory.
To examine the recession's potential impact on these flows, we carefully combine analysis of the most recent data with a nuanced understanding of the motivations and likely behavior of immigrants, America's immigration history, and a degree of professional judgment.
Changes in Immigrant Flows to the United States
Over the past decade, the flow of legal permanent immigrants has averaged about 1 million per year.
The most recent flow data on legal immigrants are for fiscal year (FY) 2008, which ended September 30, 2008. These data show that the legal immigration flow stood at 1,107,126.
We can also derive flow estimates from some sample surveys, including the Current Population Survey (CPS), a monthly survey conducted by the U.S. Bureau of Labor Statistics and the Census Bureau.
|
Related MPI Publications
|
||
|
Expert estimates based on CPS suggest a slowdown of an uncertain size in total immigration. Pew Hispanic Center demographer Jeffrey Passel estimates that immigration from Mexico has slowed and that flows from Central America show signs of a decrease as well although the magnitude of these changes is not clear.
Other data sources confirm the change in immigration from Mexico. According to the National Survey of Occupations and Employment—a labor force survey of 120,000 Mexican households conducted quarterly by Mexico's official statistical agency—the rate of outmigration from Mexico in the summer (May to August) has slowed over the past two years from 10.5 per 1,000 residents in 2006 to 9.2 per 1,000 in 2007 to 6.0 in 2008.
Slowing migration from Central America may reflect increasing cooperation from Mexican authorities to limit the entry of third-country nationals most likely to subsequently attempt to enter the United States illegally.
Immigration from South America has decelerated but is in line with longer-term trends since about 2000. This may result from U.S. consular officials tightening visa-issuing policies for some South American countries. It may also reflect the increasingly diverse destinations of South American migrants who have begun immigrating in larger numbers to countries like Spain, Japan, and Italy over the past decade.
Immigration flows from Europe and Canada also appear to be slowing. By contrast, immigration from Asia appears to be increasing; flows from the Middle East are also increasing but are very small overall.
According to Pew Hispanic Center estimates, the growth of the unauthorized immigrant population in the United States has been flat for the past two years.
Changes in the Number of Immigrants in the United States
Available data suggest slower growth in the stock of immigrants. The 2007 data from the American Community Survey (ACS) of the U.S. Census Bureau show a net increase of just over 500,000 immigrants between 2006 and 2007 (from 37.5 million to 38.1 million).
In contrast, between 2000 and 2006, ACS and other data sources suggest the net annual increase in the foreign-born population was higher—approaching 1 million.
More recent monthly data from CPS show the immigrant population leveling off since mid-2007 although the data also reflect seasonal trends (see Figure 1).
|
|
||
|
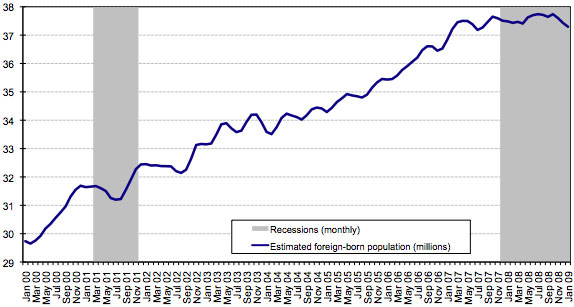
In January 2009, CPS counted about 37.1 million immigrants in the United States, slightly down from 37.4 million in January 2008. However, because of statistical variation in population sampling in the CPS, it is not clear whether the observed changes amount to an actual decline.
One possible influence on trends observed in CPS could be that illegally resident immigrants may be reluctant to respond to government surveys in an environment of strongly increasing enforcement. Also, greater proportions of more mobile, even itinerant, legal and unauthorized immigrants in search of jobs could also have a small effect.
CPS data also show that similar to the recent past, the number of Mexican and Central American immigrants in the United States fluctuates seasonally although the overall direction continues to be generally upward (see Figure 2). The number of immigrants from other regions also displays some seasonal trends, but the general trend has been flat for about a year.
|
|
||
|

Future Flows
Knowing the complexities of the U.S. immigration system and understanding immigrants' motivations can provide insight into how the flows through different legal channels might behave during the current recession.
Migration to the United States is composed of four main flows: Lawful permanent residents (LPRs), humanitarian migrants (including refugees and asylum seekers), temporary workers and students, and unauthorized migrants. Some flows are larger than others, and each type is likely to respond differently to changing labor-market conditions.
As of 2005, LPRs made up 28 percent of all immigrants residing in the United States, humanitarian migrants 7 percent, legal temporary residents 3 percent, and unauthorized immigrants 30 percent; the remaining 32 percent were naturalized citizens.
- LPRs. The largest legal group, they are admitted to the United States primarily because of family ties. Of course, family (re)unification immigrants have immediate access to the labor market and do work. Still, only about 15 percent of all LPRs are admitted directly for employment.
LPRs undergo a lengthy official immigration application process, and most have to endure long waiting periods. Some LPR family and employment categories have annual limits. Note: some immigrants enter the United States as temporary residents but then adjust to LPR status; others arrive once they receive permanent residency.
- Humanitarian migrants. Refugees are resettled in an orderly manner from large pools of eligible applicants while asylum seekers apply for refugee status after arriving at a port of entry or from inside the United States following a change of circumstances in their home country. Both groups can eventually become LPRs. The president sets refugee admissions each year; Congress must approve the ceiling.
- Legal temporary residents. Includes temporary workers and students. Temporary workers are admitted on work visas issued after a successful petition by their prospective employer. Students enter the United States on visas whose duration corresponds to the term of their studies. They can work part-time in the United States, and most students may work for a period of up to 18 months after completing their studies under the Optional Practical Training (OPT) regulation.
- Unauthorized immigrants. This group includes those who either entered the country illegally—typically by crossing the border with Mexico—or overstayed or otherwise violated the terms of a valid visa.
As a general rule, LPR flows are less responsive to the U.S. economic cycle than those for unauthorized immigrants and temporary workers for three reasons.
First, those who adjust to LPR status (known as status adjusters) are typically more attached to the labor market than new arrivals and tend to be more easily embedded in the U.S. economy and society than newly arriving immigrants. The majority of LPRs in recent years—58 percent between 1998 and 2007—have been status adjusters who already reside in the United States.
Over the 1998-2007 period, status adjusters were about three times more likely to be sponsored by an employer than newly arriving LPRs (21 percent of status adjusters compared to 7 percent of new arrivals). Accordingly, the number of new status adjusters is less likely to immediately respond to changes in the labor market since so many are already employed and do not need to find new jobs.
Second, pent-up demand for employment-sponsored visas means that actual lower admissions in these categories are not anticipated in the immediate future. Although they are designed to respond to labor needs, employment-based admissions do not appear to respond to short-lived business-cycle fluctuations.
Whenever a visa category has more applicants than available visas, the category becomes "oversubscribed," and immigrant visas are issued in the chronological order in which the petitions were filed until the annual numerical limit for the category is reached.
As of March 6, 2009, the State Department was processing visas for certain skilled employment-based visas filed between November 1, 2001, and February 15, 2005, depending on the applicant's nationality. Even if new demand for employer-sponsored visas falls, pent-up demand will likely continue to drive employment-based immigration in the short term.
Third, since employment-based immigrants make up about 15 percent of all LPR inflows, slackened demand for such visas in 2009 would have a small effect on overall permanent admissions. Family (re)unification, in contrast, accounts for about two-thirds of lawful permanent immigration.
In light of the relatively long waits and significant costs involved in obtaining a green card, it is unlikely that most family immigrants would change their plans due to what is often perceived, at least initially, as a temporary decline in economic activity.
Because humanitarian migrants are fleeing persecution, their flows are also typically unrelated to economic conditions.
Budget allocations for the refugee resettlement program can be susceptible to budget cuts that often occur during economic downturns, but overall, one should expect foreign wars, other international political upheavals, and changes in U.S. policy priorities (such as increased admissions of Iraqi refugees) to be much more important than U.S. economic conditions in determining refugee flows.
As a result, if the economic crisis leads to humanitarian emergencies—such as armed conflicts or famines—new pressures on humanitarian flows could emerge, and the U.S. government would likely respond in ways that could include some new admissions.
In contrast to LPRs and humanitarian migrants, many temporary worker flows gradually adjust to labor-market conditions, but do so at different speeds.
Temporary worker programs are intended to fill seasonal and other temporary labor-market gaps. But the duration and conditions of admission for temporary workers range widely. Some visas can be valid for as long as six years while others are valid for a few months or indefinitely.
Many visa types have annual limits either through annual quotas (e.g., H-1B "specialty occupation" visas) or through mandated proof from employers that no U.S. workers are available for a particular job (e.g., H-2A visas for agricultural workers).
Temporary worker programs that require proof from employers might be expected to respond relatively quickly to the business cycle. Rising unemployment during recessions presumably steers workers already in the country toward sectors where jobs are available. These trends might lead to fewer labor shortages and lower demand for temporary workers.
However, this adjustment does not occur automatically.
Some unemployed workers already in the country—including both natives and immigrants—may be unwilling to move to regions where jobs are available. Their reasons may include family ties or other personal constraints. They may also be unwilling to take jobs they find financially or socially unattractive, or they may not have the specialized knowledge or training some available jobs require.
As a result, worker shortages may continue in certain occupations as well as in those expected to grow robustly, such as health and elder care.
When they have alternatives to participation in the labor force, some workers may choose to continue their education rather than move or remain unemployed. Others may prefer to drop out of the labor force entirely, deciding to rely on their savings, the income (and the hospitality) of family members, or the social safety net.
The degree to which unemployed workers already in the country are willing and able to adjust to a changing labor market will strongly influence the demand for temporary workers during a recession.
Student migration is a relatively new policy field so there is little analysis of how flows of foreign students might react to the business cycle. Students are not fully attached to the labor market although some may work full- or part-time.
However, the specific characteristics of the current economic crisis may have two types of consequences for foreign students.
First, many foreign students in the United States receive scholarships and grants that make it possible for them to attend U.S. universities. These resources may become scarcer due to financial market volatility.
Second, students who, in the past, were able to finance their studies through family support and part-time work and are unable to obtain scholarships or grants may face new financial realities—especially if the economic crisis has adversely affected their family finances.
Since demand for visas from both U.S. employers and foreign workers exceeds the supply, the U.S. immigration system's rigidities essentially force many economic migrants into illegal channels.
Accordingly, illegal immigration flows should be more responsive to economic changes than legal immigration flows even though economic prospects at home and family reunification are also factors.
The evidence overall confirms this viewpoint and suggests that illegal immigration flows tend to be most responsive to the U.S. economy.
While U.S. employment prospects motivate unauthorized migrants to come, other factors also influence their migration decisions. As a result, large-scale return migration of the unauthorized is unlikely absent protracted and severe economic conditions in the United States.
Indeed, several characteristics of this population and recent trends along the Southwest border and in Mexico and Central America suggest that large returns may be unlikely. These include
- unauthorized immigrants' high degree of attachment to the labor force;
- unauthorized workers' greater mobility between sectors and high geographic mobility within the United States;
- the rising cost of illegal entry to the United States, which has contributed to reducing back-and-forth migration dramatically over the past two decades;
- increasing drug-related violence in Mexico and Central America.
Historical Trends
Each period of U.S. history is unique so historical comparisons must be taken with caution. However, available historical evidence does not suggest a direct, long-term relationship between legal immigration flows and the U.S. economy's ups and downs.
Changes in the volume of immigration flows following recent recessions appear to be mostly the result of policy changes and administrative delays although some variation — especially in much earlier times—is likely due to economic conditions as well.
The Mexican Migration Project at Princeton University and the University of Guadalajara in Mexico found that during the Great Depression, the annual flow of legal immigrants from Mexico declined dramatically from around 46,000 per year during the 1920s to less than 2,700 per year during the 1930s, when the U.S. government conducted systematic roundup and removal operations directed at Mexican workers.
More recent Migration Policy Institute (MPI) analysis of Department of Homeland Security (DHS) data on legal permanent immigrant admissions and National Bureau of Economic Research historical data on U.S. recessions show that the decline in legal immigration observed during the Great Depression (the recession that officially lasted from August 1929 to March 1933) actually began in 1928—before the stock market crash of 1929 (see Figure 3).
|
|
||
|

This timing suggests that the Immigration Act of 1924, which took effect in 1928, may explain a large portion of the decline in legal immigration observed during the Great Depression. The act imposed severe quotas, limiting the annual inflow of new immigrants from most countries.
As for return migration, it is widely accepted that the emigration rate of immigrants increased significantly during the Great Depression despite issues of data quality. Between 1928 and 1937, over half a million immigrants left the United States.
However, it is not clear if they returned to their home countries or settled elsewhere. While about one immigrant departed for every three admitted between 1908 and 1957 (the last year for which the now defunct Immigration and Naturalization Service [INS] kept data), the ratio rose to one departure for every two entries during the Great Depression.
Political and legal factors also clearly influence immigration trends observed for the past three decades. Examples include the Immigration Reform and Control Act (IRCA) of 1986 and policy changes following the September 11, 2001, terrorist attacks.
IRCA legalized nearly 3 million unauthorized immigrants in the years following 1987, causing legal flow numbers to surge (although these immigrants had been in the country for years) and setting the stage for the growth in family (re)unification cases observed since then. It also reformed the seasonal agricultural worker program and made it illegal for employers to hire unauthorized workers.
In this context, then, the dramatic decline in admissions following the July 1990 to March 1991 recession is largely the result of the end of IRCA legalizations.
During the 2001 recession, the number of immigrants initially declined, but the flow began increasing again midway through the recession, in September 2001 (see Figure 2). The drop in flows that followed the 2001 recession, therefore, is strongly related to the heightened security climate following September 11, 2001.
In the months after the September 11 attacks, both INS, whose responsibilities now rest with DHS, and the State Department extensively changed procedures to strengthen security screening and divert adjudications personnel and resources to security operations.
The changes required more rigorous reviews of all immigration applicants from the Federal Bureau of Investigation (FBI). Visa processing slowed for all applicants in 2002 and 2003, but the process ground to a virtual halt—sometimes for years—for a subset of applicants about whom the FBI had questions.
By contrast, estimates of the unauthorized population over time show a strong correlation with the business cycle in recent years. Although the data sources are flawed, they provide the most complete portrait currently possible.
From 2000 to 2008, the unauthorized population increased from an estimated 8.4 million to 11.9 million, or more than 40 percent, according to a recent Pew Hispanic Center report. This population grew each year except for 2001-2002 and 2007-2008.
Thus, the only two time periods since 2000 when the estimated unauthorized population in the United States did not increase have been the most recent recession and the current recession (though results for the latter could represent a slowdown in growth and therefore require cautious interpretation).
Border apprehensions data add support to the conclusion that illegal immigration is correlated with the business cycle. Federal Reserve Bank of Dallas Senior Economist Pia Orrenius observes that when a six-month lead is accounted for, fluctuations in migrant apprehensions along the Southwest border have closely tracked changes in U.S. labor demand since about the 2001 recession (see Figure 4).
Using survey data from interviews with immigrants in the Mexican state of Oaxaca and in San Diego County, California, political scientist Wayne Cornelius and colleagues reached a similar conclusion.
|
|
||
|

Additional Factors
In addition to changing demand for workers in the U.S. labor market, several other variables are contributing to the trends in immigration observed since the economic crisis began:
- changing U.S. federal immigration enforcement policies and strategies, notably border enforcement and deportations
- state laws targeting unauthorized immigrants and their employers
- the economies of migrant-sending economies, especially Mexico and Central America
- currency fluctuations in response to the business cycle
- the intensity of anti-immigrant animus in many parts of the country
Here we explore the effects of enforcement policies and state laws, as well as Mexico's economy, in more depth.
Some observers have argued that increasingly strict enforcement of immigration laws is deterring illegal immigration and convincing some unauthorized migrants to return to their home countries. A recent study suggested that a significant drop in the number of less-educated Hispanic immigrants in the monthly CPS data, from summer 2007 to spring 2008, could be attributed in part to the economy and in part to enforcement.
DHS formally deported 319,382 immigrants in FY 2007—a record number and a 14 percent increase from 2006. That figure grew to about 361,000 in FY 2008 according to preliminary DHS reports.
In addition, DHS has conducted a steady stream of high-profile worksite raids, often arresting significant numbers of unauthorized workers for removal. Teams of immigration enforcement agents, in an initiative called the National Fugitive Operations Program (NFOP), have located growing numbers of noncitizens with outstanding orders of removal because of nonimmigration crimes, as well as unauthorized immigrants who happen to be in the same household or nearby.
At the same time, several states—most notably Arizona, Colorado, Mississippi, Oklahoma, and South Carolina—have enacted legislation designed to curb illegal immigration. Measures include mandating verification of employment eligibility and restricting eligibility for public services, among others.
Data are not yet available to show definitive trends, but anecdotal evidence from media reports suggests that some immigrants (both legal and unauthorized) are leaving states that have imposed strict immigration regulations.
It is not possible to identify the destinations of those who have left these states. Also, it is difficult to separate the effects of the economic crisis from those of much more stringent enforcement regimes and the unwelcoming environment that enforcement creates.
However, unless enforcement—both on the federal and state levels—is both intense and equally pursued across the country, state laws and selective enforcement strategies will probably first divert unauthorized immigrants to other destinations within the United States rather than induce return migration. They may also force unauthorized immigrants into increasingly informal and precarious employment situations and further isolate them from U.S. society.
In the context of a slowing economy, state laws and selective enforcement could also erode a state's attractiveness to businesses and encourage businesses to relocate to neighboring states.
Driving migration are both the economic climate in source countries and the prospect of employment in destination countries. The perception of a large "opportunity differential" leads many to migrate.
The forecast for Mexico's economy has been continually revised downward over recent months. In October 2008, the International Monetary Fund expected economic growth in Mexico to drop from 4.9 percent in 2006 to 1.8 percent in 2009.
By December 2008, the World Bank predicted economic growth to slow to 1.1 percent. More recently, the Bank of Mexico estimated the Mexican economy could contract by as much as 2 percent in 2009.
Historically, economic crises in Mexico have resulted in higher levels of migration to the United States.
In a study correlating apprehensions along the Southwest border with relative wages in the United States and Mexico, economists Gordon Hanson and Antonio Spilimbergo concluded that when wages in Mexico change relative to wages in the United States, apprehensions respond within the current month.
More precisely, they estimate that a 10 percent decrease in the Mexican real wage relative to the United States gives rise to at least a 6.4 to 8.7 percent increase in attempted illegal immigration.
Factors in Return Flows
Where the opportunity differential between sending and receiving countries remains large, return migration is typically seasonal, for investment or entrepreneurial activities, or for retirement.
The ease of circulation and the strength of attachments that migrants maintain with their countries of origin are also important variables that influence return migration.
Recent evidence from migration flows between Poland—which joined the European Union in 2004—and the United Kingdom and Ireland suggests that when job opportunities disappear in the country of destination, having the guaranteed right to return encourages circular movements.
This scenario may be less likely if the job market in the country of origin remains weak. The lack of widespread return among North and Sub-Saharan African immigrants in Spain, despite record unemployment, illustrates this point.
Conclusion
This analysis leaves many unanswered questions, in large part because there is relatively little systematic empirical work about the ways immigrants respond to business-cycle fluctuations, and because the United States faces a recession whose likely depth we have not experienced since the Great Depression.
In many ways it is inappropriate to compare the current crisis with the Great Depression. The United States and other advanced economies have an array of public- and private-sector tools and the financial wherewithal not available in the 1930s. Nonetheless, the most vulnerable may experience economic pain quite similarly.
While a severe economic downturn may not immediately appear to be the most opportune moment to address the chronic disconnect between the U.S. immigration system and its labor market, farsighted policymakers will recognize that the crisis may provide impetus toward creating a more nimble and thoughtful immigration system.
Sources
Borjas, George J. 2001. Does Immigration Grease the Wheels of the Labor Market? Brookings Papers on Economic Activity, No. 1, March. Available online.
Camarota, Steven A. and Karen Jensenius. 2008. Homeward Bound: Recent Immigration Enforcement and the Decline in the Illegal Alien Population. Washington, DC: Center for Immigration Studies. Available online.
Capps, Randy and Karina Fortuny. 2006. Immigration and Child and Family Policy. Paper prepared for the Urban Institute and Child Trends Roundtable on Children in Low-Income Families, January 12, 2006. Available online.
Capps, Randy, Karina Fortuny, and Michael E. Fix. 2007. Trends in the Low-Wage Immigrant Labor Force, 2000-2005. Washington, DC: The Urban Institute. Available online.
Cornelius, Wayne. 2005. Controlling 'Unwanted' Immigration: Lessons from the United States, 1993-2004. Journal of Ethnic and Migration Studies 31 (4): 775-794.
Government of Mexico. Instituto Nacional de Estadística, Geografía e Informática. 2008. Hasta Agosto de 2008 Continúa la Tendencia Decreciente en la Emigración Internacional. Communication No. 270/08, Aguascalientes, Mexico, December 18, 2008. Available online.
Hanson, Gordon. 2007. The Economic Logic of Illegal Immigration. Council on Foreign Relations, Council Special Report No. 26, April 2007. Available online.
Hanson, Gordon H. and Antonio Spilimbergo. 1999. Illegal Immigration, Border Enforcement, and Relative Wages: Evidence from Apprehensions at the U.S.-Mexico Border. American Economic Review 89 (5): 1337-1357.
Massey Douglas S., Jorge Durand, and Nolan J. Malone. 2003. Beyond Smoke and Mirrors: Mexican Immigration in an Era of Economic Integration. New York: Russell Sage Foundation.
Papademetriou, Demetrios. 2004. The Shifting Expectations of Free Trade and Migration. In NAFTA's Promise and Reality: Lessons from Mexico for the Hemisphere. Washington, DC: Carnegie Endowment for International Peace. Available online.
Passel, Jeffrey S. 2006. The Size and Characteristics of the Unauthorized Migrant Population in the U.S.. Washington, DC: Pew Hispanic Center. Available online.
Passel, Jeffrey S. and D'Vera Cohn. 2008. Trends in Unauthorized Immigration: Undocumented Inflow Now Trails Legal Inflow. Washington, DC: Pew Hispanic Center. Available online.
Pollard, Naomi, Maria Latorre, and Dhananjaya Sriskandarajah. 2008. Floodgates or Turnstiles? Post-EU Enlargement Migration Flows to (and from) the UK. London: Institute for Public Policy Research. Available online.
Reyes, Belinda. 1997. Dynamics of Immigration: Return Migration to Western Mexico. San Francisco: Public Policy Institute of California. Available online.
Rodriguez, Cristina, Muzaffar Chishti, and Kimberly Nortman. 2007. Testing the Limits: Assessing the Legality of State and Local Immigration Measures. Washington, DC: Migration Policy Institute. Available online.
Saxenian, AnnaLee. 2006. The New Argonauts: Regional Advantage in the Global Economy. Cambridge, MA: Harvard University Press.
U.S. Bureau of the Census. 1960. Historical Statistics of the United States, Washington, DC: U.S. Government Printing Office. Table available online.
U.S. Department of Homeland Security, Immigration and Customs Enforcement. 2008. ICE Fugitive Operations Program. Fact Sheet, November 2008. Available online.
U.S. Department of Homeland Security, Immigration and Customs Enforcement. 2008. Frequently Asked Questions About Worksite Enforcement. Fact Sheet, August 2008.
US Department of Homeland Security. 2008. Extending Period of Optional Practical Training by 17 Months for F-1 Nonimmigrant Students With STEM Degrees and Expanding Cap-Gap Relief for All F-1 Students with Pending H-1B Petitions. Federal Register 73 (68), April 8. Available online.
U.S. Department of Homeland Security, Office of Immigration Statistics. 2008. Yearbook of Immigration Statistics 2007. Washington, DC: DHS. Available online.
Zhao,Yaohui. 2002. Causes and Consequences of Return Migration: Recent Evidence from China. Journal of Comparative Economics 30, no. 2 (June): 376-394.
Zúñiga Herrera, Elena, Paula Leite Neves, and Luis Acevedo Prieto. 2006. Mexico-United States Migration: Regional and State Overview Mexico, DF: Consejo Nacional de Población.